Viewing Scans in FieldLink
After scanning an area, you can view the scan three different ways - plan view, station view and perspective view. Each of these views offers unique features that can help you access information immediately.
Viewing Options Ribbon
The ribbon on the bottom left of the screen holds several different options for viewing scan data. This includes station color options, point size, station markers and numbers, and cloud view options.
![]()
Scan Data Colors
Station Color ![]() shows each scan station as a different color. The colors are automatically assigned during the scanning process.
shows each scan station as a different color. The colors are automatically assigned during the scanning process.
Intensity ![]() shows the reflectivity of the surfaces or objects in the scan. Blue and darker areas on a scan mean the area is more reflective from the scanner perspective. Red means the area had more absorptive surfaces from the scanner perspective. Highly absorptive or reflective surfaces may cause loss of point data or less dense scans.
shows the reflectivity of the surfaces or objects in the scan. Blue and darker areas on a scan mean the area is more reflective from the scanner perspective. Red means the area had more absorptive surfaces from the scanner perspective. Highly absorptive or reflective surfaces may cause loss of point data or less dense scans.
Grayscale ![]() shows the scans in grayscale. Grayscale is useful to view data even if there is no ambient light available during the scanning process.
shows the scans in grayscale. Grayscale is useful to view data even if there is no ambient light available during the scanning process.
Truecolor ![]() shows the scan as it’s true color. The software overlays the colorized photos from the instrument and matches it point by point with the data to show the point cloud in its real colors. This option is only available if you have colorized the scans.
shows the scan as it’s true color. The software overlays the colorized photos from the instrument and matches it point by point with the data to show the point cloud in its real colors. This option is only available if you have colorized the scans.
Elevation ![]() shows elevation lines to represent where each part of the scan is along the Z-axis. You can use these to align scans that are not registering along the Z-axis.
shows elevation lines to represent where each part of the scan is along the Z-axis. You can use these to align scans that are not registering along the Z-axis.
Registered Groups ![]() shows each registered group as a different color. You can group scans by different areas, floors, or regions for easier registration, viewing, or exporting.
shows each registered group as a different color. You can group scans by different areas, floors, or regions for easier registration, viewing, or exporting.
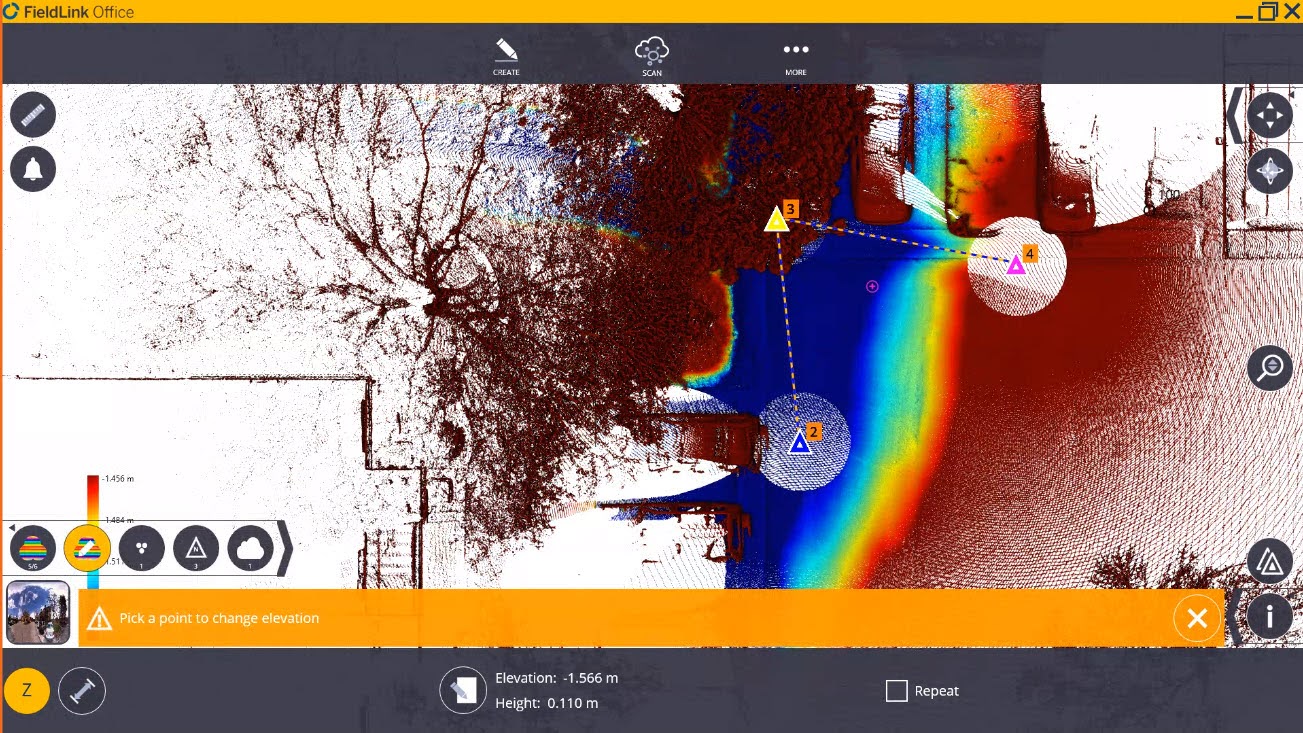
Changing Scan Elevation Settings
When selecting the “Elevation” color option, you can set the distance between color repetition or choose to turn off the repeating color pattern in order to customize the elevation data. To do this:
- Open the Viewing Options Ribbon and select the colors icon until it cycles to Elevation view. The elevation settings icon appears in the ribbon.
- Tap on the Elevation Settings
 icon.
icon. - A purple crosshair appears on screen. This is setting the lowest elevation mark for the customizable elevation bar. This is by default at 0. To edit the lowest elevation mark, you must tap on the crosshair. A message saying “Please pick the starting point” appears.
- Once a lowest point has been established, select an endpoint by tapping on the screen.
NOTE – If you want to lock the Z axis, select the Z axis lock icon in the bottom left corner
- If you do not want the elevation colors to repeat, you can uncheck the Repeat checkbox.
- The edit icon in the center of the bottom toolbar allows you to manually enter elevations.
Point Size
You can select from three different point sizes ![]() .1 pixel is the smallest point while 3 pixels is a larger point.
.1 pixel is the smallest point while 3 pixels is a larger point.
Station Markers
You can turn on and turn off the station markers and numbers to better view the scan data.
Station Markers OFF ![]()
Station Markers ON
![]() . The color of the triangle relates to the automatically assigned scan color.
. The color of the triangle relates to the automatically assigned scan color.
Station Markers and Station Numbers ON ![]()
Point Cloud View Options
The default option on a point cloud is to have all the points visible so that you can navigate in and around those points. There are three options under this icon.
Full Cloud ![]() is the default option that allows you to see the point cloud in its entirety.
is the default option that allows you to see the point cloud in its entirety.
Look Inside ![]() allows you to remove the data from the ceiling/roof/walls in order to see a floor plan view of scan data without having to create a section box or go to the station view.
allows you to remove the data from the ceiling/roof/walls in order to see a floor plan view of scan data without having to create a section box or go to the station view.
Outline ![]() only shows the outline of walls, structural steel, pipe, or other features, allowing for easy visualization of the floor plan and edges.
only shows the outline of walls, structural steel, pipe, or other features, allowing for easy visualization of the floor plan and edges.
Plan View
Plan view allows you to see a top-down view of the scan.
- Tap the More icon
 .
. - Select Map.
- To recenter scans on the screen, press the four-arrow icon in the top right ribbon.
- This ribbon also contains multiple views including plan view, two elevation views (front and right), isometric view, and the plan view, or switch between parallel and perspective views.
- You can also use the Orbit
 button to navigate freely through the data in 3D.
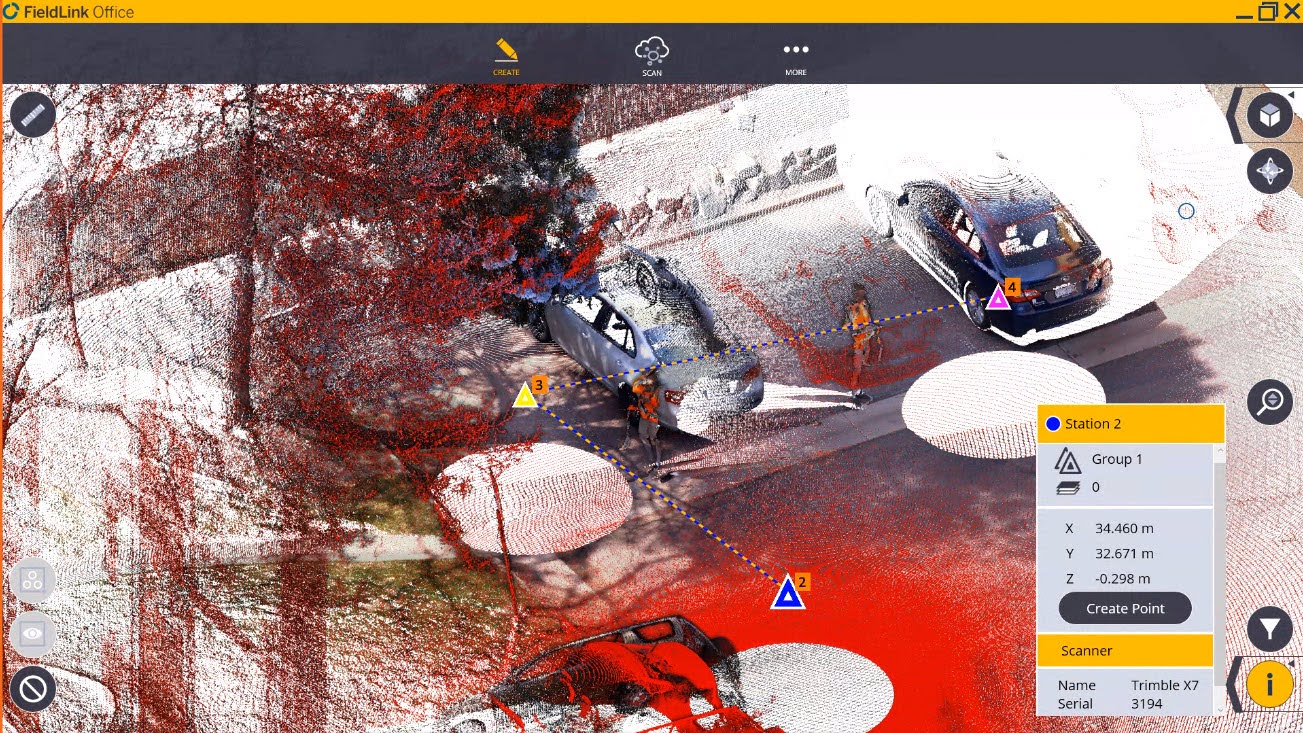
Station View
Station View allows you to view the point cloud or images from the X7/X9 perspective. This view includes an almost 365° panoramic view of the area around the instrument. You can also access the perspective and panorama views from the Station View.
- Select the station view window located at the bottom left of the Map. By default it shows Station 1 in Group 1.
- Once inside of the station view, there are two dropdown menus - one to select the group and one to select the station number inside of that group. You can also cycle through stations using the arrow icons.
-
You can now use the View Options Ribbon to change the color of the scan. You can cycle between four options - grayscale, true color, unmeasured points, and scan intensity.
Using Station View to Control Laser Pointer
In the Trimble X7/X9 firmware version R2.1.4 and later, the built-in laser pointer on the Trimble X7/X9 can be controlled by tapping on the screen inside of a station view format. To control the laser pointer by tapping on the screen:
- Collect a scan with the Trimble X7/X9 by tapping Scan and then tapping Collect.
CAUTION – Once the scan is complete, do not move the scanner. If you move the scanner then the camera icon will not appear.
- Tap Measure
 in the top menu.
 - Tap either Lay Out or Collect.
- The Trimble X7/X9 automatically levels itself and a message appears saying “Setup has not been completed”. You can set up the instrument on two known points at this time but it is not required to use the station view as a controller for the laser pointer.
- Once this is complete, the Camera icon
 appears. Tap the Camera icon.
 - The software opens station view. A message appears along the bottom of the screen advising you to “Tap anywhere in the scan to point the laser”.
- Once you tap on the screen, the laser pointer on the Trimble X7/X9 moves and points to that spot.
- To increase accuracy, zoom in on the screen or walk to where you would like the laser pointer to appear and use the Dynamic Joystick
 to nudge the laser into place.
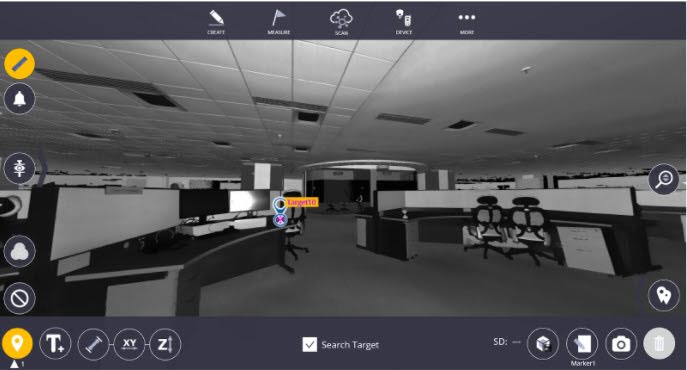
Search and Tap for Targets in Station View
After scanning an area with targets placed around the site, FieldLink can search and automatically identify targets by using the “Search for Target” feature. To search and automatically identify targets:
-
Open Station View.
-
Select the Search Target check box. Select the Add point on marker check box if you want to create a point for each target. The created points will be saved in the TFLX file.
-
Tap a target in view. If a target cannot be found, try using a different station view to search for the target.
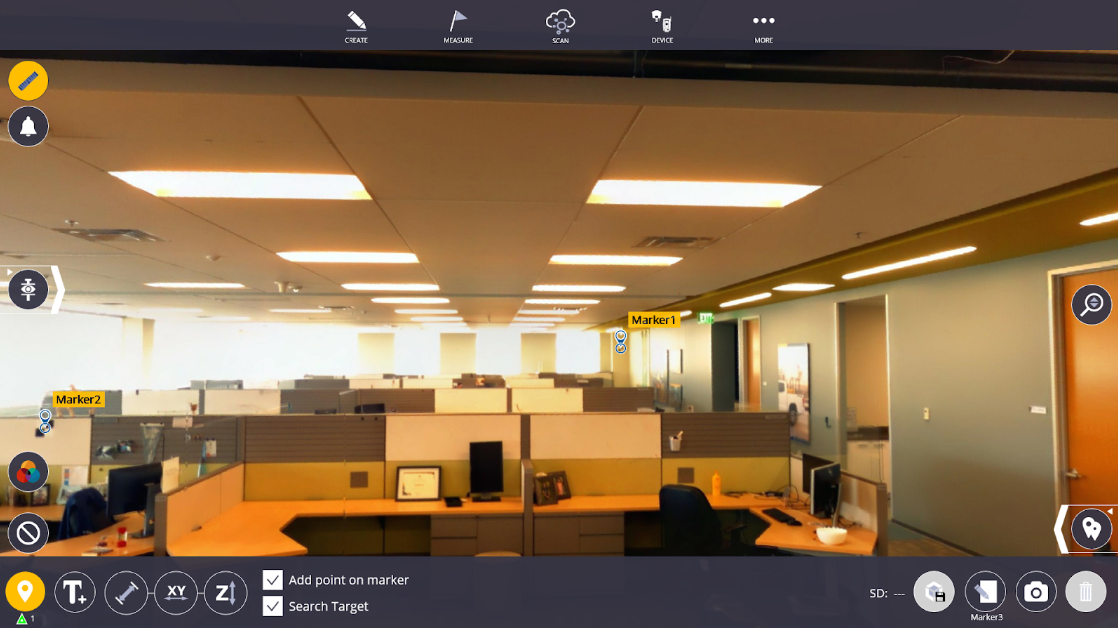
-
Use the edit icon to edit the marker name and description.
-
Perform this step for all the targets in view of the scan.
-
Once these points are selected, then you can perform a regular resection or measurement.
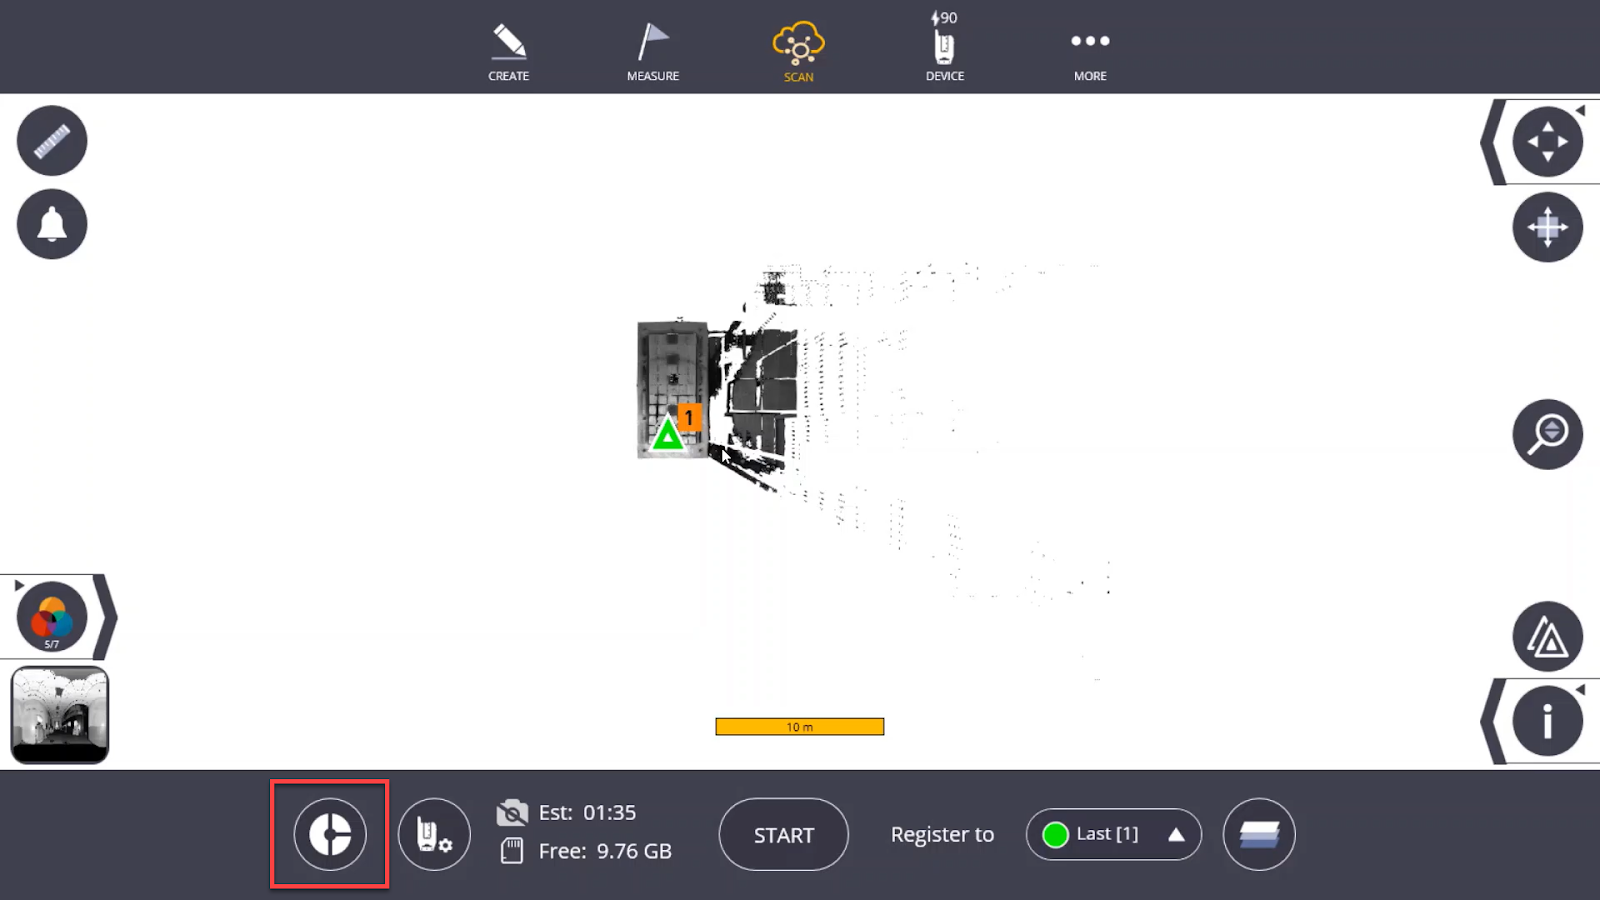
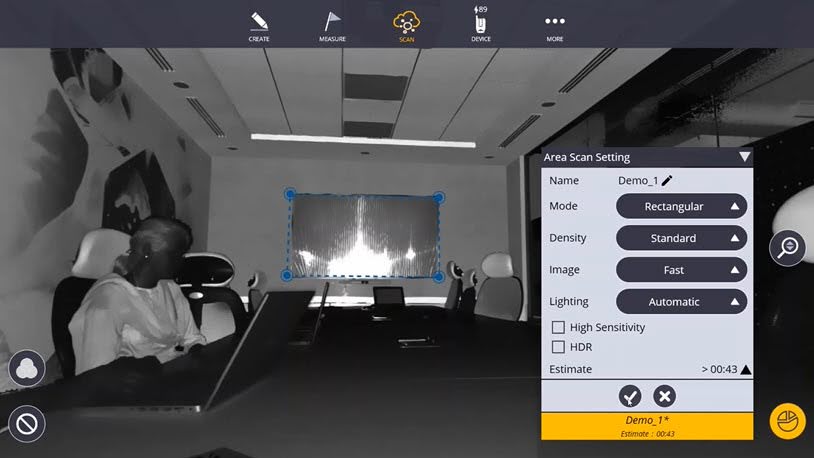
Area Scan in Station View
After an initial scan has been completed, you have the option to perform an Area Scan inside of Station View. Area Scan allows you to select a window or area inside of a Station View and perform a scan of only the selected area. This is useful for easily exporting scans if you wants to export/analyze only a small section of a scan and not the entire scan.
Once a scan is completed, the Area Scan icon populates the Collect workscreen. After the Area Scan option is selected, the Station View is shown where you can select the area for the Area Scan.
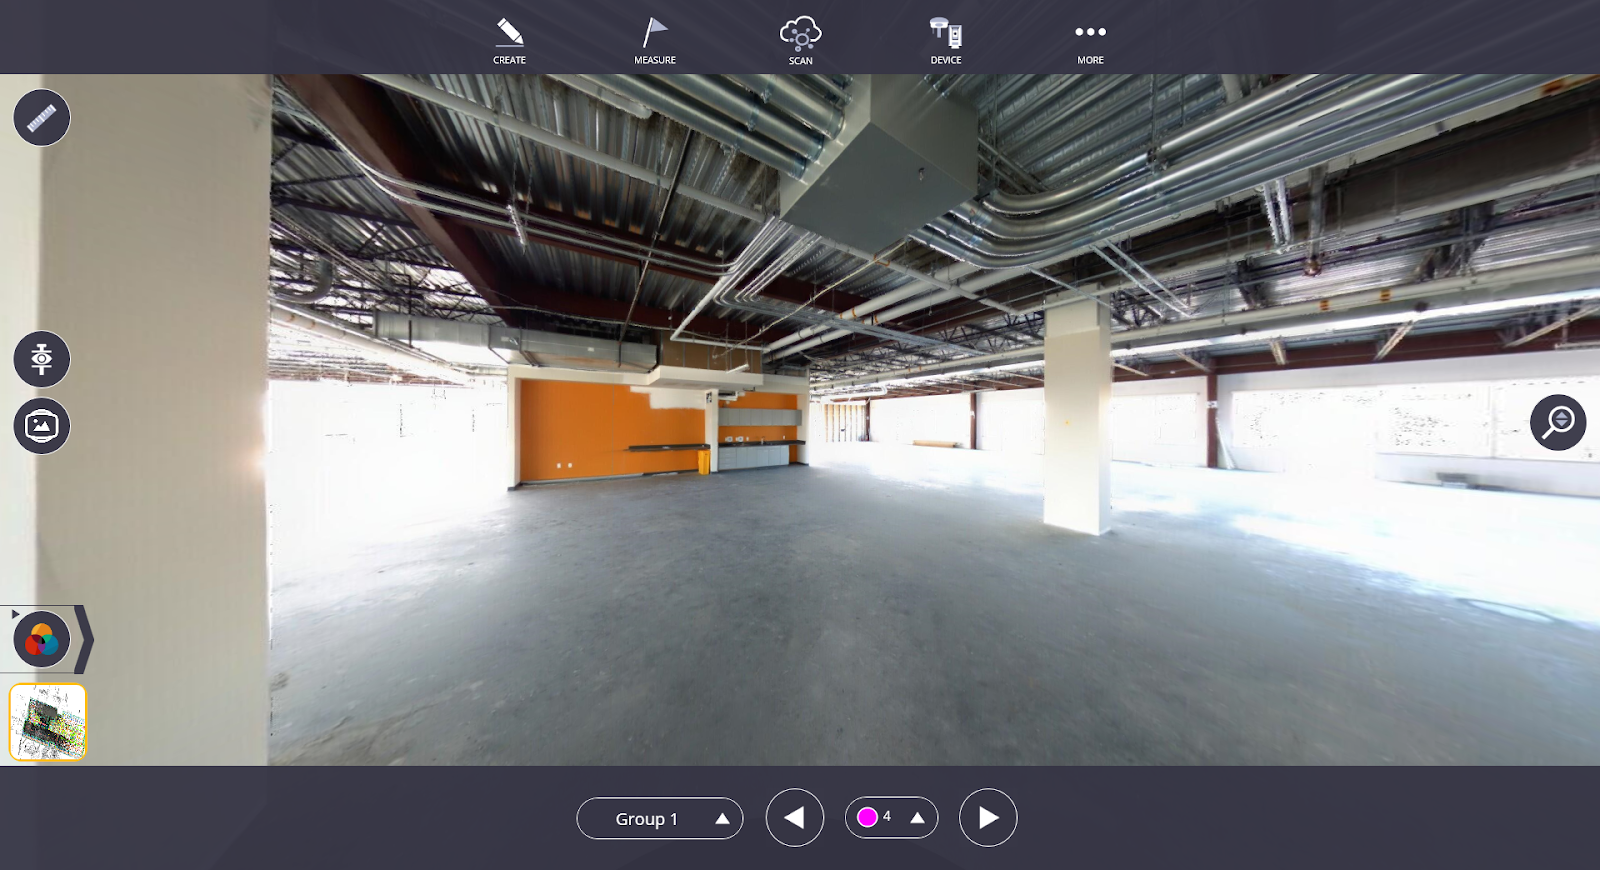
Perspective View
You can find Perspective View ![]() and Panorama View
and Panorama View ![]() on the left side of the screen inside of Station View. In Perspective View, you are still viewing from the instrument perspective but now you can see the point clouds and any background PDF files, plans, or models loaded into the project.
on the left side of the screen inside of Station View. In Perspective View, you are still viewing from the instrument perspective but now you can see the point clouds and any background PDF files, plans, or models loaded into the project.
- Inside of Station View, select the Perspective Icon.
- On the bottom of the screen, you can navigate between stations and groups.
- The Zoom Slider
 on the right side of the screen can assist in zooming in on the point clouds. You can also use pinch to zoom.
 - Perspective View also has the Viewing Options Ribbon to change the appearance of the point cloud. See Viewing Options Ribbon for more information.
- To exit Perspective View, either select the Perspective View icon again or select the map on the bottom left corner.
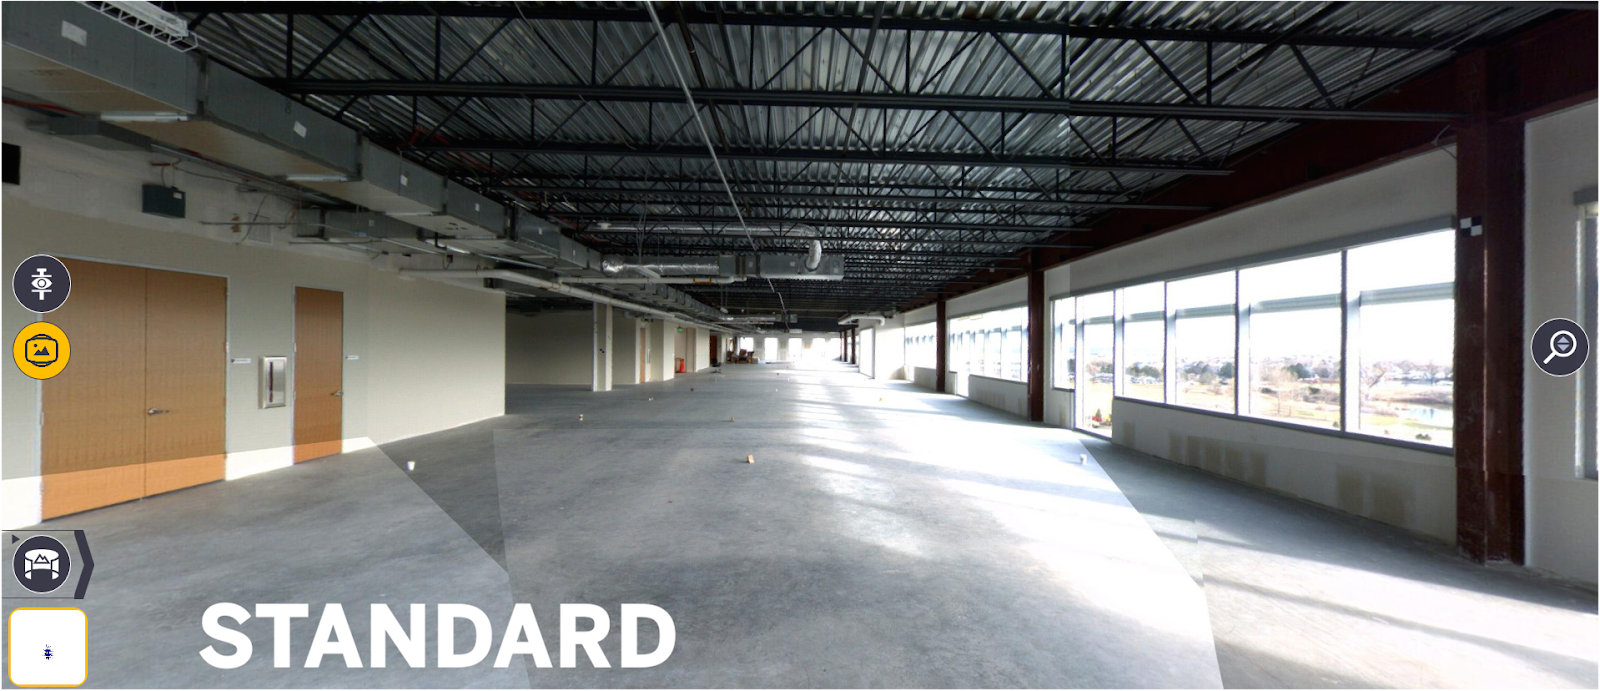
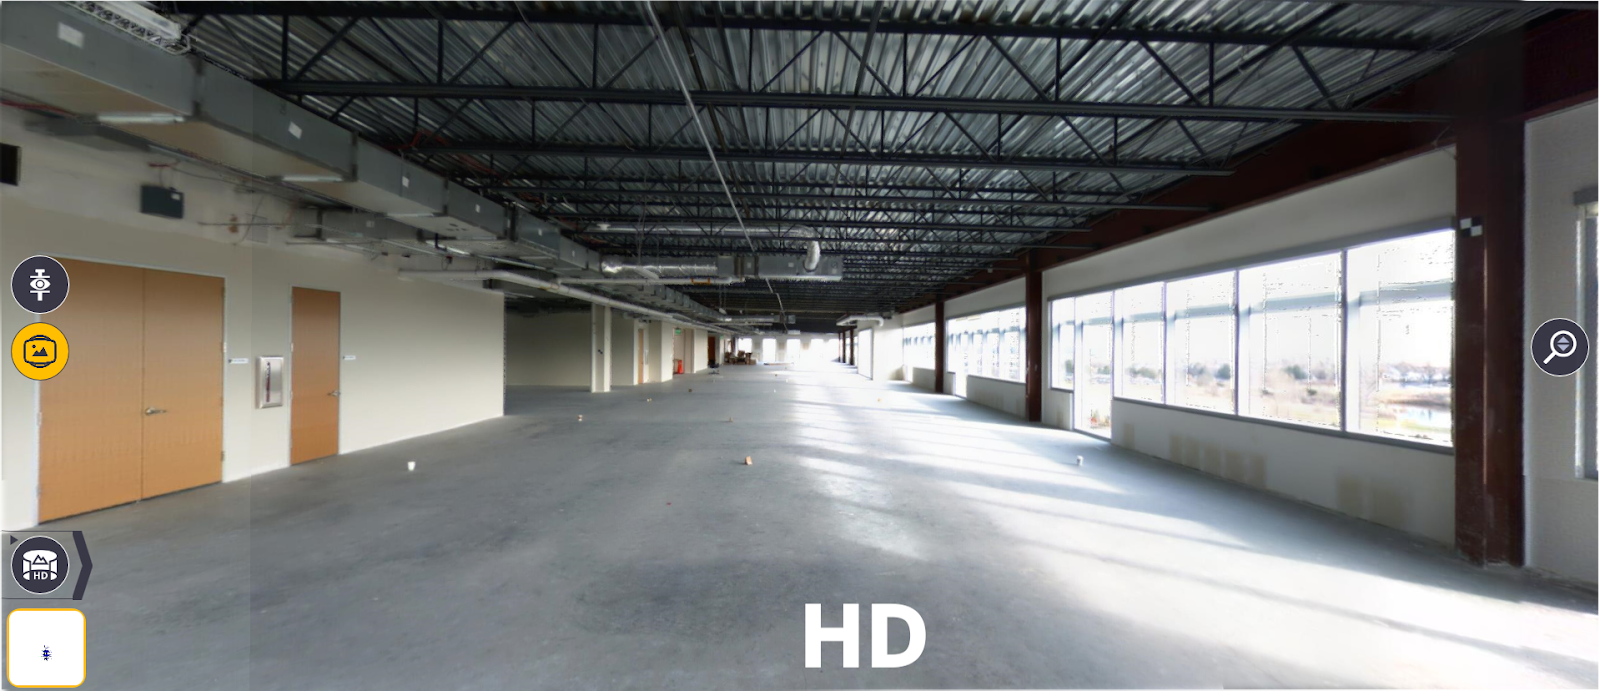
Viewing Panorama Images
Once you have generated a panoramic image (to learn how to create panoramic images see Creating Panorama), to view them :
- Open Perspective View
 .
. - Tap the ribbon arrow next to the Perspective View icon
 .
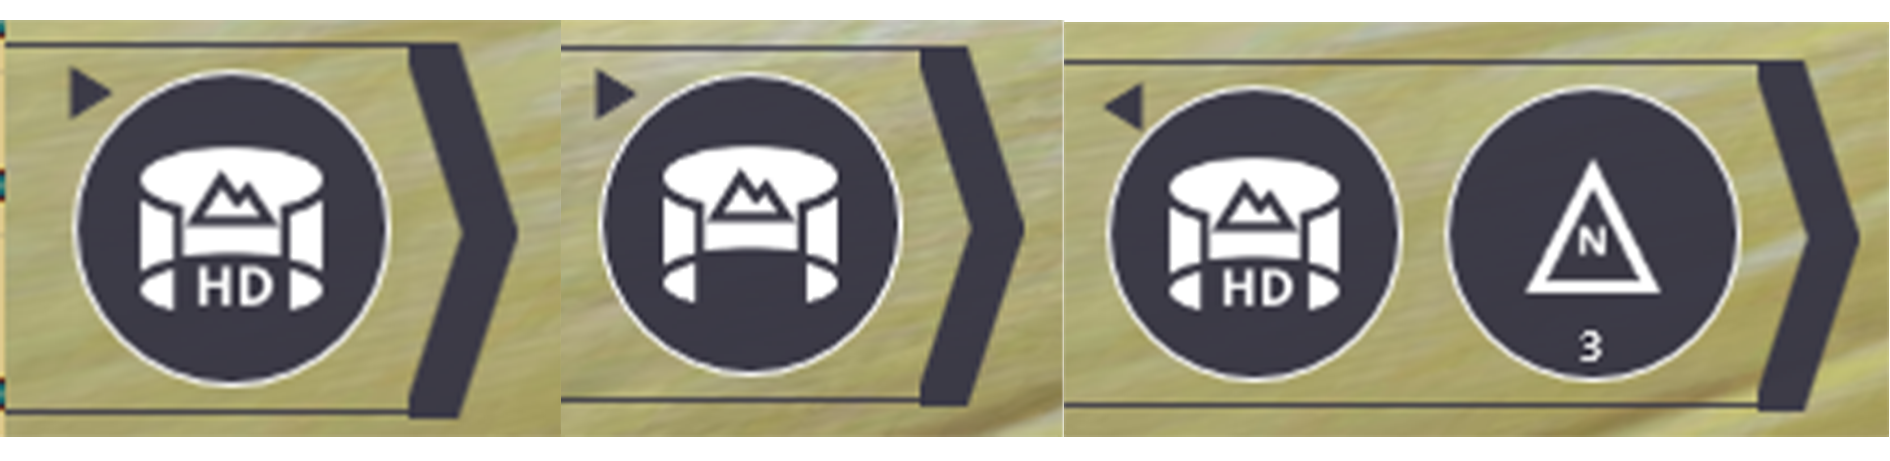
. - Tap the Panorama icon
 .
. - If you have created a High Quality panorama, tap on the Panorama Type icon
 in the lower left hand corner.
 - By tapping on this icon, you can cycle through HD panoramas and preview or SD panoramas. Also, by opening this ribbon, you can also toggle the station markers on or off.
NOTE – To learn the difference between a High Quality and Preview panorama, seeDifferences between High Quality Panorama and Preview Panorama.
To access these images, make sure to Save As your project after creating panoramas and open File Explorer where they are located under This PC > Documents > Trimble FieldLink > Jobs > Job Name.dat > Scans > Images > HighResolution.
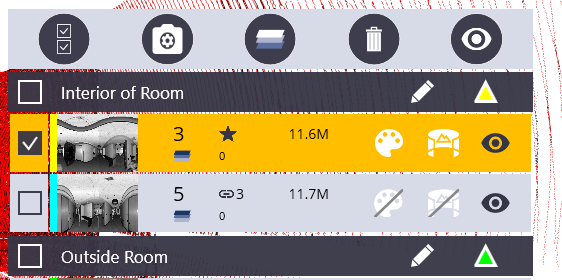
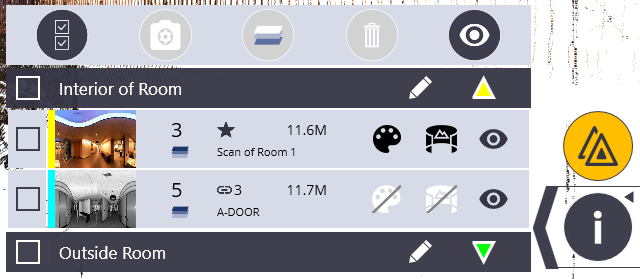
Station Manager
Station Manager ![]() allows you to hide and unhide scans, colorize scans, create panoramic images, check to see what station each scan is registered too, check the size of each point cloud, delete scans, and select and highlight individual or groups of scans.
allows you to hide and unhide scans, colorize scans, create panoramic images, check to see what station each scan is registered too, check the size of each point cloud, delete scans, and select and highlight individual or groups of scans.
Select/Deselect All ![]()
Panorama and Colorization ![]()
Layer Assignment ![]()
Delete Scan ![]()
Hide/Unhide All ![]()
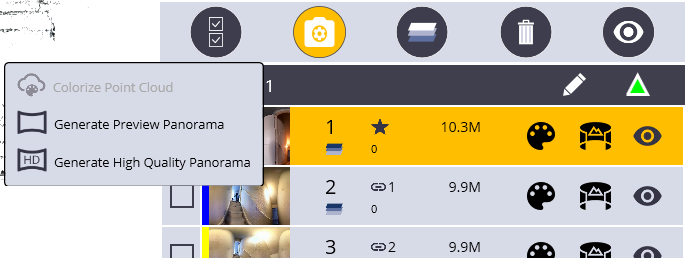
Colorizing a Scan
To colorize a scan:
- Tap either the group or individual scan you would like to colorize.

- Tap the Panorama and Colorization icon
 .
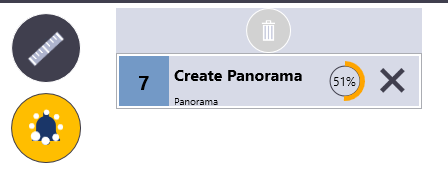
. - When the settings menu opens you can now use either the Colorize Point Cloud, the Generate Preview Panorama or the Generate High Quality Panorama tools. In this case, select Colorize Point Cloud.

-
Once you tap on that, the Art Palette icon
 begins to spin. This means the software is working on colorizing this point cloud in the background. You can check the status of this process by tapping on the notification bell in the top left corner.
Creating Panorama
To create a panorama:
- Tap either the group or individual scan you would like to generate a panoramic image for.
- Tap on the Panorama and Colorization icon .
- When the settings menu opens you can now use either the Colorize Point Cloud, the Generate Preview Panorama or the Generate High Quality Panorama tools. In this case, select Generate Preview Panorama (see Differences between High Quality Panorama and Preview Panorama to learn about the differences between these methods).
- Once you tap on that, the Art Palette icon begins to spin. This means the software is working on colorizing this point cloud in the background. You can check the status of this process by tapping on the notification bell in the top left corner.
Differences between High Quality Panorama and Preview Panorama
The differences between a “High Quality” generated panorama and a “Preview” panorama is that the High Quality image that is generated smoothes out the stitched edges between each of the images in the panorama and creates a seamless image. However, in doing so, it diminishes the visibility of items in each of the photos. So, for example, if you had text in one of the pieces of the panorama, it would become a bit blurry and hard to read. The “Preview” panorama looks more cut together and blocky because it keeps the full resolution of each individual image in the final stitched panorama. This allows you to zoom in on a part of the image and be able to interpret items that are shown in the image such as text. See examples below:
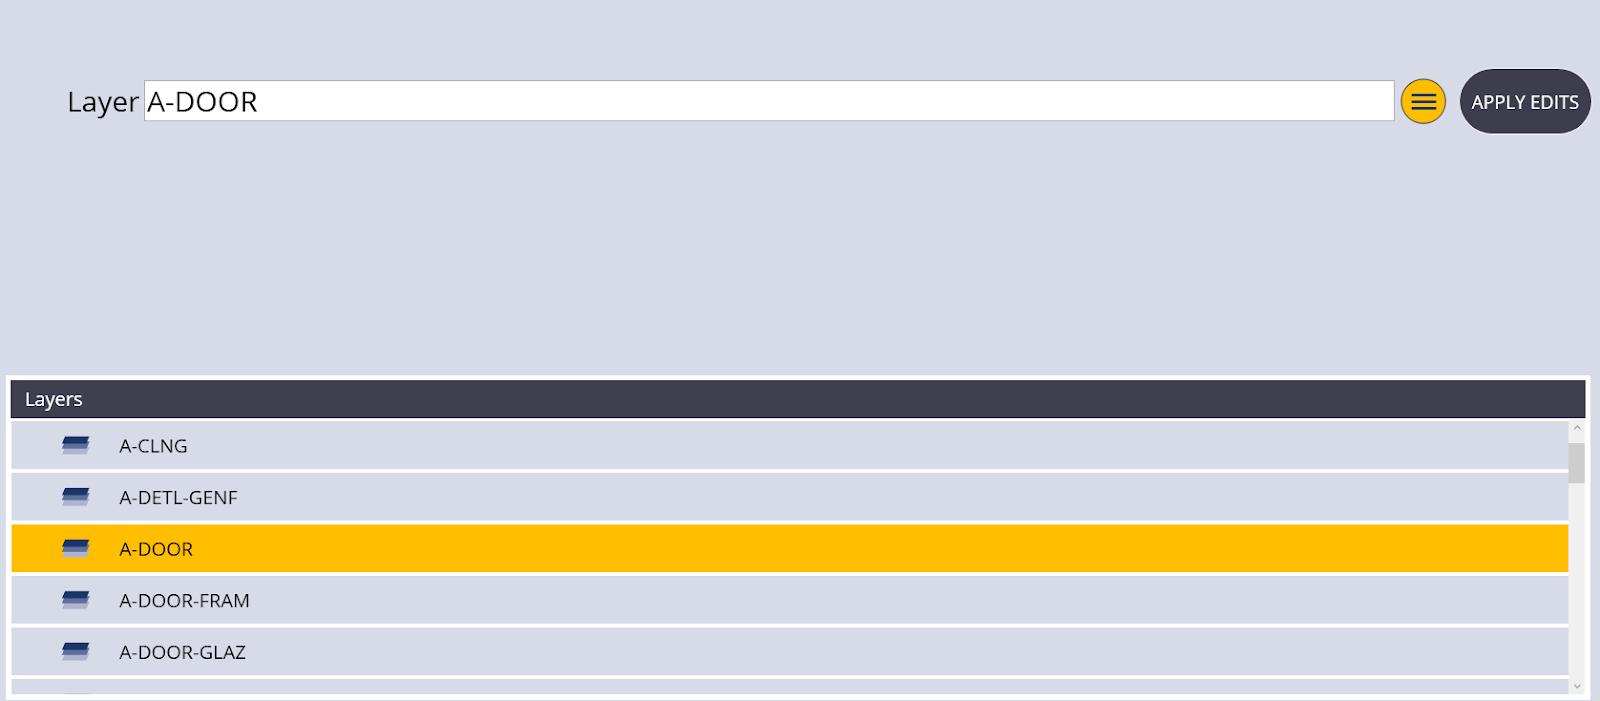
Assigning Scans to Layers
When you have a model in a FieldLink job, along with several scans, annotations, markers, layout points, etc. it can become difficult to navigate around the project. Assigning a scan to a layer inside the model once everything has been aligned can greatly assist you in the process of hiding and isolating areas where you want to focus your attention. To assign a scan to a layer:
- Open Station Manager
 .
. - Tap the station/scan you would like to assign to a layer.
- Tap the Layer Assignment icon
 .
. - The Layer Assignment menu appears and you can either create a new layer or open the layers panel to assign it to an existing layer.
- To assign to an existing layer click on the Menu
 icon to the right of the text box.
 - Select which layer you want to assign the scan to and then tap on the Apply Edits button to close the menu.
- Now when you open the Station Manager you will see next to the station number that the scan has been assigned to a layer. When you manipulate this layer through the settings menu, this scan will be affected as well.
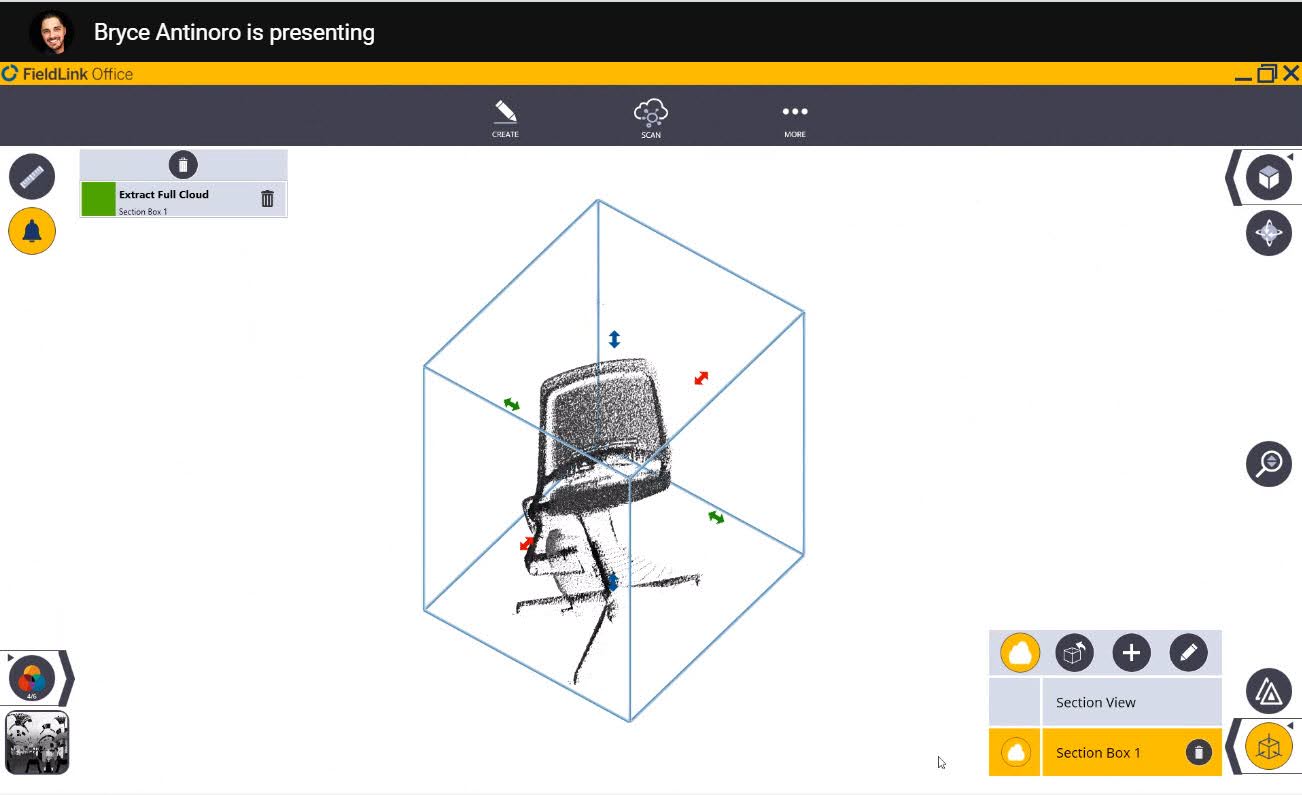
Extract Detail/Density from Region Within Scans
When viewing point clouds in FieldLink, only a percentage of the points in the point cloud are displayed. To view all of the points in a desired area of the scan, you will need to extract the extra points:
- Tap on the information ribbon and select the Section View icon. If the model has many independent sections, you can shrink the section view with the arrows to encompass the only section of interest. If the model is a 3D model, you can select the 3D icon in the top right to be able to shrink the model in the 3 axis if desired.
- In the section view, select the + sign to create a new section view. You can select the pencil icon to rename the new section view and give it dimensions if desired.
- Once the new section view is created, select the cloud icon next to the section view you would like to increase the point density on.
- Once FieldLink has processed the extra points, you can toggle this dense section on and off by tapping on the cloud icon again.
Create TFL Points from Scanned Data
In most cases, a field point is required in a project in order to layout a point using an instrument. Creating a field point can also help when measuring between a model and point cloud. To create a point from scan data:
-
Tap the Info icon
 in the bottom right corner .
 -
Tap a point on the point cloud. A circle appears around where you selected.
-
Tap the Create Point button under the Info button.
Turn Instrument Laser to Selected Scanned Point
You can turn the instrument laser to a selected scanned point from the Info icon. To do this:
- Tap the Info icon in the bottom right corner .
- Tap a point on the point cloud. A circle appears around where you selected.
- Tap the Turn to Point icon under the Info icon.
