Visualizing point clouds in Siteworks
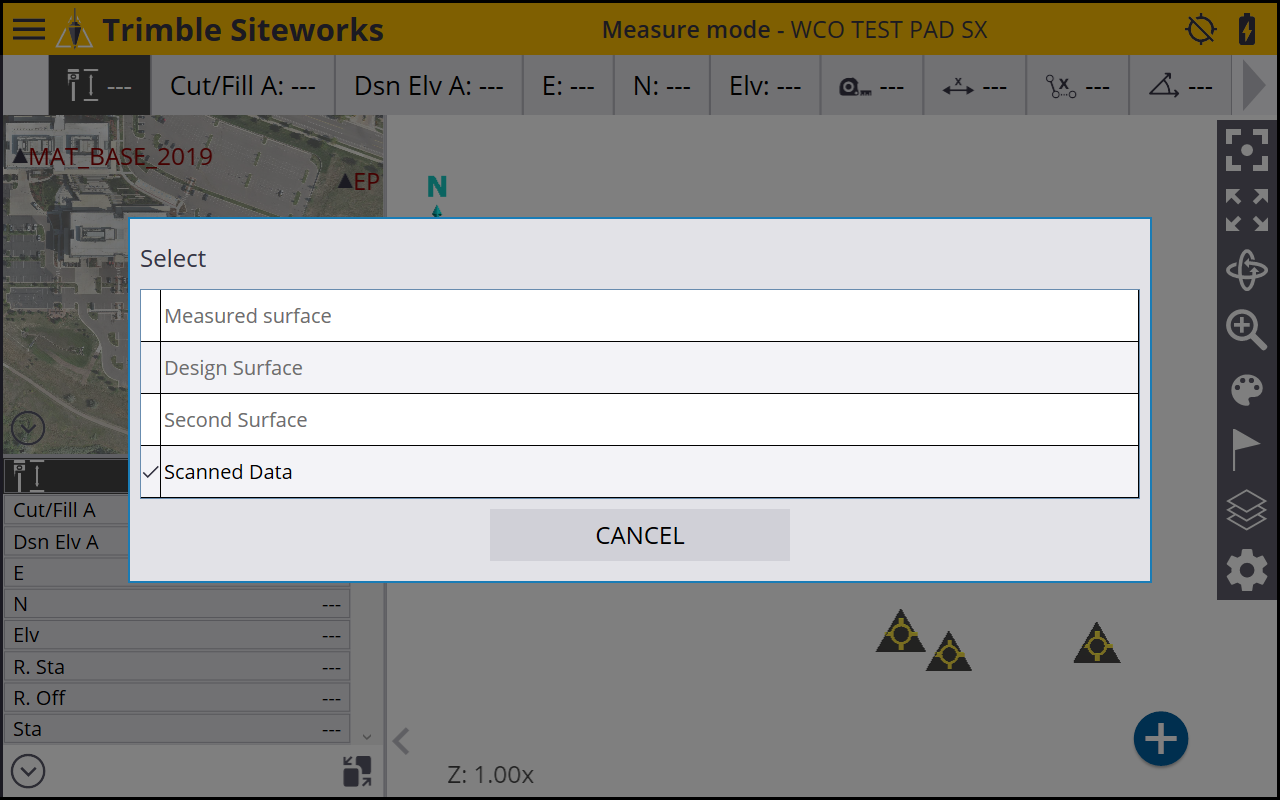
Collected point clouds are visualized in the 3D window on the main Siteworks screen. When the 3D window is in the main panel, tap the surface selection icon ![]() from the 3D view toolbar and select Scanned Data.
from the 3D view toolbar and select Scanned Data.
A progress bar appears while Siteworks creates the necessary database files in the currently opens Scan Data folder of the work order.
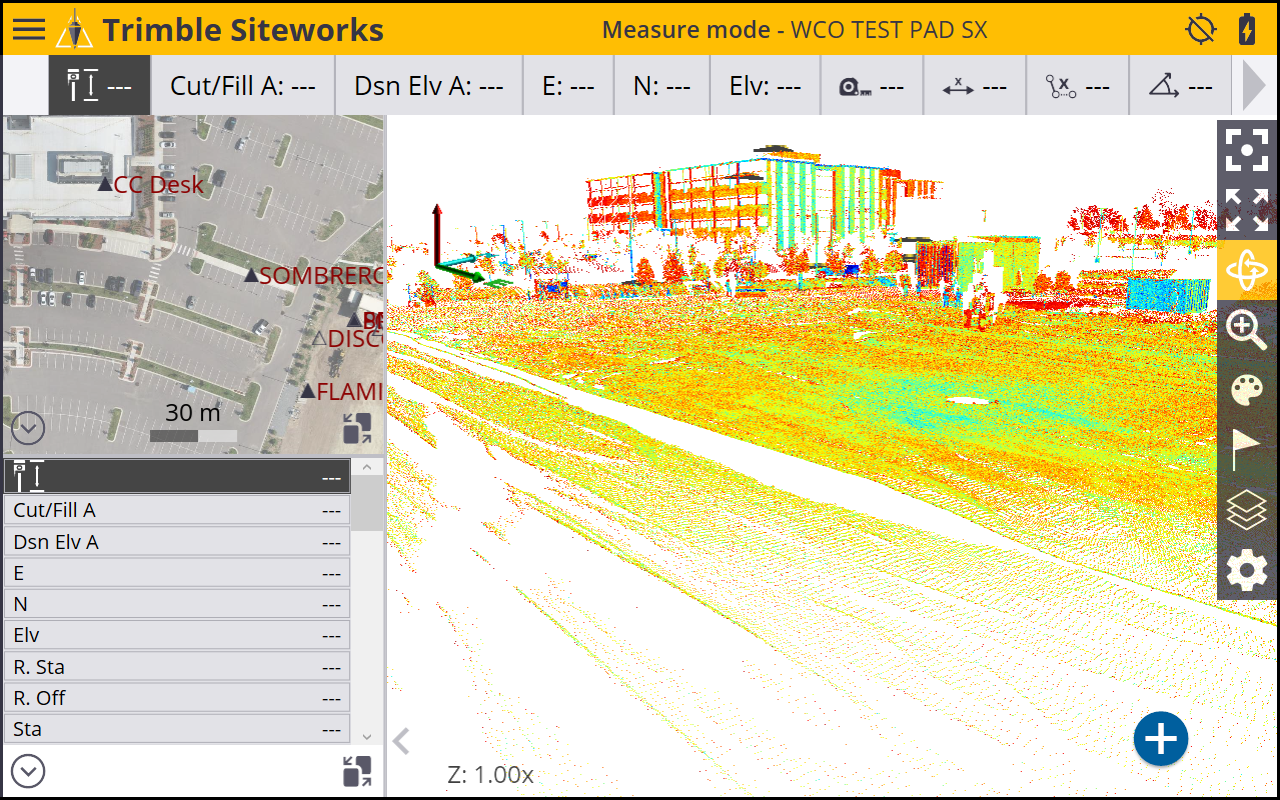
Due to some of the internal visualization settings in Siteworks, the point cloud may not appear immediately as it can take several seconds to render the point cloud in the 3D view.
All standard 3D view controls for center on position, zoom extents, rotate, zoom, etc., all work the same with point clouds, as with surfaces.
All scans collected in the currently open work order are displayed. To change the colors of the scan data, tap the palette icon ![]() . The following options appear:
. The following options appear:
|
Option |
Description |
|---|---|
|
Scan Color |
Each individual scan is colored separately |
|
Station Color |
All scans from a given station are the same color |
|
Gray Scaled Intensity |
All scans are gray scale based on the intensity values |
|
Color Coded Intensity |
All scans are colorized based on the intensity values |
You cannot set the colors of individual scans. Also, “true color” scans based on a colorized point cloud extracted from the photo panoramas are not available in Siteworks.
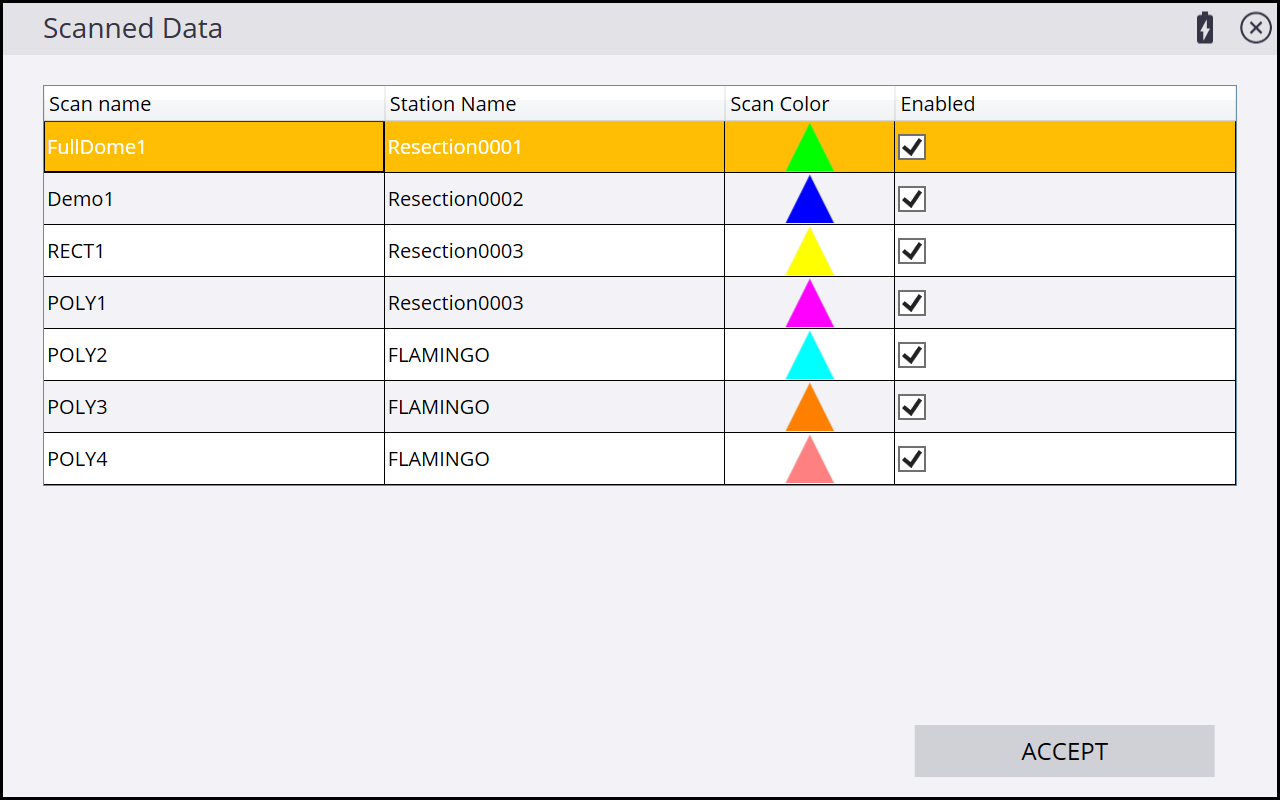
To open the Scanned Data info screen, tap ![]() when scanned data are selected. This screen displays the colors of the individual scans, and lets you turn the display of individual scans off and on by tapping the Enabled check box.
when scanned data are selected. This screen displays the colors of the individual scans, and lets you turn the display of individual scans off and on by tapping the Enabled check box.