Run a Tunnel Undulation Report
The Tunnel Undulation Report enables you to use point cloud or total station data to measure the evenness/smoothness of an as-built tunnel mesh to, for example, analyze a shotcrete surface before the membrane system for waterproofing is applied. This is done as a quality check to identify out-of-tolerance areas requiring attention. Simply select the as-built mesh, specify the maximum bar length to be used for measurements, and specify the waviness tolerance that, if exceeded when measuring the deepest point from the bar, will cause the measured area to be flagged and included in the report.
Prerequisites:
- Licensed module. See the Subscription Plans page. For a license matrix by command, see the License page in the TBC Community. Also see View and manage licensed features.
- An as-built tunnel mesh.
To set Tunnel Undulation Report options:
- Select Report Options in the Quick Access Toolbar to display the Report Options command pane.
- In the Reports list, select Tunnel Undulation Report.
- Edit Settings options as necessary.
To run a Tunnel Undulation Report:
- Select Tunnel Undulation Report in Tunnels > Reports> Undulation to display the Create Tunnel Undulation Report command pane.
In the Report template drop-down list, select Tunnel Undulation Report, or select a customized version of the report if available.
To create a customized version of the Tunnel Undulation Report,see Create and Edit Customized Report Templates.
- In the Tunnel as-built mesh drop-down list, select the tunnel as-built mesh on which to base the report.
- In the Station interval field, specify the interval between stations for which you want to include tunnel cross-sections showing undulation in the report.
- In the Maximum bar length field, enter the maximum length of the bar to be used for measurements.
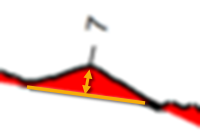
The bar acts as a straightedge along the tunnel surface profile from which measurements to the surface are made to determine the depth of troughs between peaks. If the distance between two peaks is equal to or less than this length, the related scan points are measured from the bar bridging peaks to determine if any exceed the waviness criteria distance you enter in the next step. If the distance between two peaks is greater than this length, no measurements are made.
- In the Waviness criteria field, specify the perpendicular depth/distance from any location along the bar beyond which a measured scan point will cause the measured area to be flagged and included in the report.
For example, if the perpendicular distance from any location along the bar to the surface exceeds the specified distance, the bar and the area between its two peaks will be colored red in the cross-section view in the report and will be included in the undulation report table for that station.
- In the Image Scaling for Cross-Section View group box, select the most appropriate option:
- Use the same scale for all stations - All cross-sections displayed in the report will be drawn to the same scale.
- Best-fit scale per station - All cross-sections displayed in the report will be drawn to the maximum size allowed in the page layout regardless of the scale.
- Click the Apply button.
The progress of the report creation process is displayed in the Status Bar at the bottom of the TBC window. When complete. the report opens in MS Word.
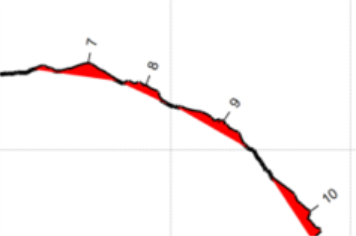
By default, each station in the report is displayed on two pages. The first page shows a cross-section view of the tunnel with a graphic indication of the tunnel undulation exceeded for each measured bar at that station. Each bar with an exceeded measurement is assigned a segment number for cross-referencing. The page also shows information about the tunnel cross-section and computation values.
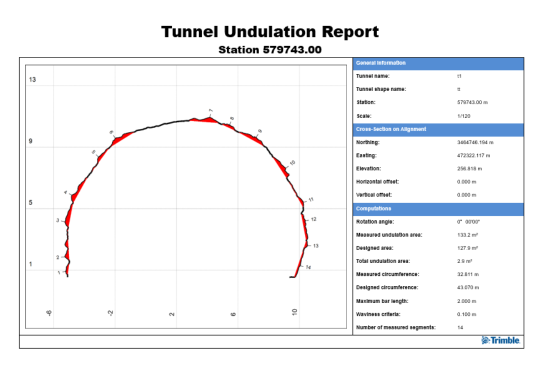
Note that the leader line for each segment number indicates exactly where the farthest point from the bar is located for that segment.
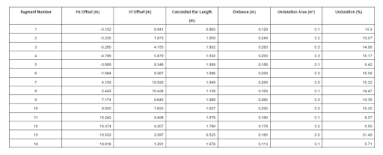
The second page for each station includes a table showing specific undulation information for each segment identified on the first page.
- Optionally, save the Word file with a new name to the location of your choice.
