Grid Volume from Boundary
 The Grid Volume from Boundary command computes the volumes between two selected surfaces and within multiple selected boundaries using the grid volume method. The computations are much faster than the standard surface to surface, even with a small defined grid interval. You can export an Excel report of the results and plot the results to screen.
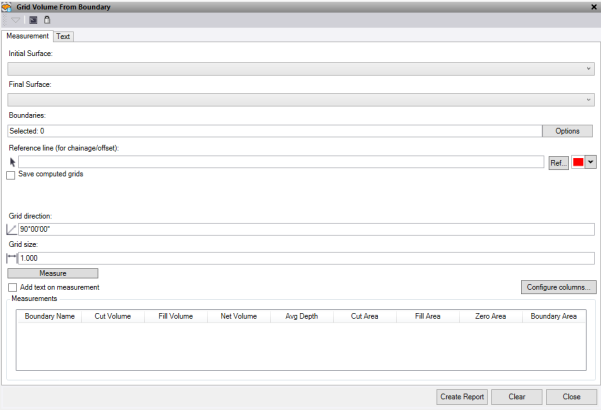
Measurement Tab
- Select the Inital Surface to determine the volumes.
- Select the Final Surface to determine the volumes.
- Select the Boundaries to use to report the volumes.
- Check Save Computed grid to save the computed results in the current TBC project. The computed grids are stored in the Stored Measurements section of the Project Explorer and can be turned on and off in the Stored Measurements section of the View Filter Manager. The name for the new Grid volume is taken from the boundary string.
- In the graphic view, select a Reference line to the chainage and offset of the centroid of the boundaries reported. To use a line from a reference file, press Ref. Optionally, change the selection highlight Color.
- Enter the Grid Direction orientation to apply the grid for the volume calculations.
- Enter the Grid Size for the volume calculations. The smaller the grid size, the more accurate and the closer the volume will be to a surface-to-surface volume computation. Smaller grids also track the selected boundary lines better.
- Click Measure to run the grid volume using the selected objects. The measurements display in the Measurements text box.
- Check Add text on measurement to drawi the measurements directly to the screen when you click Measure. Find these settings on the Text tab.
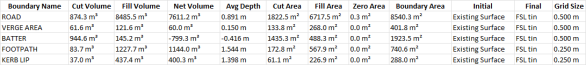
- Click Configure columns to select which measured values are displayed in the measurements text box and reported in the Excel sheet.
- Click Create Report to create an excel file of the data in the Measurements text box.
- Click Clear to clear the Measurements text box.
To draw and record the measurements
- Define the Layer. By default, a layer called Text – GridVolumeFromBoundary is automatically created.
- Select a Color.
- Select a text Style.
- Enter a text Height.
- Enter a Gap between the centroid location and the start of the text.
- Click Draw leader line with gap to add a leader line when a gap is used.
- Check Include data prefix to include the data type as a prefix to the text.
- Click Create Text to create text of all the measurements taken and currently active on the measurement tab.
- Click Clear Layer to delete everything on the selected layer that contains the text.
Example: