Inspect Line Nodes
 The Inspect Line Nodes command enables you to select a line and report the elevation, chainage, azimuth, and grades for all the nodes along the line. Annotate results to a text layer and create an Excel report.
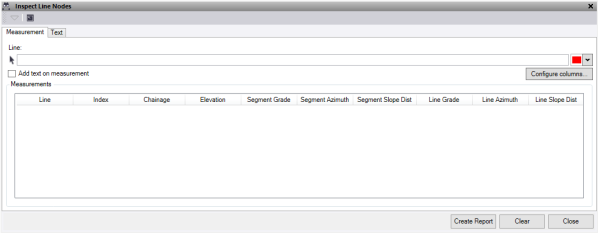
- In the Measurement tab, select a line to report.
- Check the Add text on measurement box to place the measurements directly on the screen as you select each location.
Note: The settings for text display are on the Text tab.
- Click Configure columns to nominate which measured values are displayed and reported.
- Click the Create Report button to create an excel file of the data in the Measurements text box.
- Click the Clear button to clear the measurements text box.
- Select the Text tab to draw the measurements taken and recorded in the Measurement tab.
- Define the Layer. A layer called Text – InspectLineNodes is automatically created.
- Select a Color.
- Select a text Style.
- Enter a text Height.
- Enter a Gap between the location and the start of the text. This moves the text to the left or right.
- Check the Draw leader line with gap box to add a leader line when you add a gap.
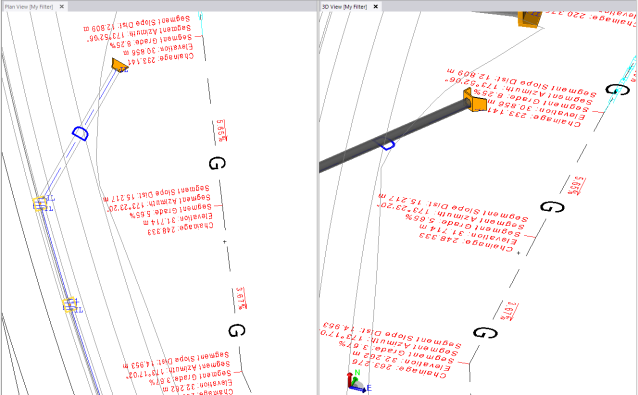
- Check the Draw grade arrows box to annotate direction arrows and grade text on each segment.
- Check Align text square to line to draw text perpendicular to the line selected.
- Check Include data prefix to include the data type as a prefix. The values available depend on the mode.
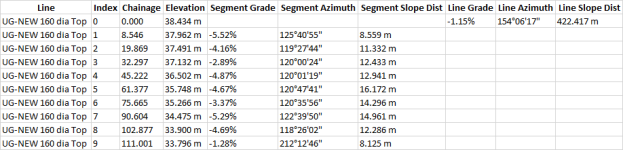
- Chainage – Chainage of nodes along the line.
- Elevation – Elevation of nodes along the line.
- Segment Grade – Horizontal Slope between nodes on the line.
- Segment Azimuth – Azimuth between nodes on the line.
- Segment Slope Dist – The 3D slope distance between nodes on the line.
- Click Create Text to create text of all the measurements taken and currently active on the Measurement tab.
- Click Clear Layer to delete everything on the selected layer that contains the text.