Run a Point Conformance Report
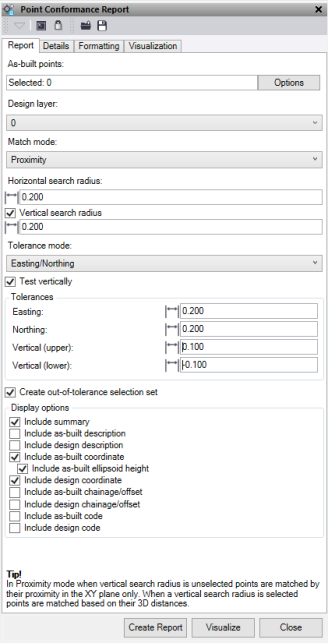
 The Point Conformance Report command is for reporting as-built points against a design point such as piles, columns, boreholes, bolts, and other points. The command has reporting method options such as tolerance mode, and allows you to create text detailing the tolerances using the visualize function.
Click Load or Save at the top of the command pane, then populate the command with the appropriate rule sets and save it in a file that can be reloaded in the future.
Report tab
|
As-Built Points |
Select the as-built points to use in the report. |
|
Design Layer |
Select the layer that contains the design points to report against. |
|
Match mode |
Select the method to use to match the design points with the as-built points Proximity – This will use the location of the as-built point and find the closest design point to compare it with. This uses a Horizontal search radius and optional Vertical search radius to confine the point selection. If the vertical search radius is unselected points are matched by their proximity in the XY plane only. When a vertical search radius is selected points are matched based on their 3d distances. Id_Exact – This will match as-built points and design points with the same point ID. Id_Closest – This will match as-built points and design points that have point ID’s which are the named the most similar. eg. P226 and P226_Asbuilt would match. |
|
Tolerance Mode |
Select the mode to use to report with. EastingNorthing – This reports the delta relative to its easting and northing difference between points. Distance – This reports the delta relative to a direct 2d distance between points. ChainageOffset – This reports the delta chainage and offset relative to a line. |
|
Test Vertically |
Check this to report horizontal and vertical deltas. If unchecked only horizontal is reported. |
|
Tolerances |
Enter a tolerance value in metre units appropriate for the mode used. |
|
Create out-of-tolerance selection set |
Check this box to create a selection set called "Out-of-tolerance (points)" with any points in the data set that did not pass. If you need to keep the selection set, then rename it before running the command again as it will be written over. |
|
Include summary |
Check this box to add the header summary and information from the details tab. |
|
Include as-built description |
Check this box to add the information stored in the description 1 & 2 of the as-built point selected. |
|
Include design description |
Check this box to add the information stored in the description 1 & 2 of the design point selected. |
|
Include as-built coordinate |
Check this box to add the point as-built coordinate to the report. |
|
Include as-built ellipsoid height |
Check this box to add the ellipsoidal height of a point to the report. (Only works if with the as-built coordinate enabled) |
|
Include design coordinate |
Check this box to add the point design coordinate to the report. |
|
Include as-built chainage/offset |
Check this box to add the point as-built chainage & offset to the report. (Only works if you are using the "ChainageOffset" mode) |
|
Include design chainage/offset |
Check this box to add the point design chainage & offset to the report. (Only works if you are using the "ChainageOffset" mode) |
|
Include as-built code |
Check this box to add the as-built point code to the report. |
|
Include design code |
Check this box to add the design point code to the report. |
Details tab
|
Title |
Enter a title for the report (for example, the project name). |
|
Custom image file |
Select a "png" or "bmp" image file to be added to the top right corner of the report. E.g., company Logo or project image. This only appears if you have a Title filled out. |
|
Description |
Enter a description for the report. |
|
Reference number |
Enter a survey job reference number. |
|
Author |
Enter the name of the report's author. |
|
Custom Header |
Enter a user defined heading |
|
Custom Text |
Enter a user defined text to go beside the Custom header |
|
Include location image |
Check this box to include a screenshot of the current view in the report. |
Formatting tab
|
Colors |
Choose the colors to be used in the Excel Report.
|
Visualization tab
|
Create visualization layers |
Check if you want conformance information to be displayed on layers in TBC. |
|
Layer prefix |
Enter a prefix to add to layer names. |
|
Text Height |
Select the height of the text to be displayed on screen |
|
Text Style |
Select the text style for the text displayed on screen |
|
Gap |
This is the distance in metres that the insertion point of the text will be right/left of the node it is created for. |
|
Rotation |
This is the rotation angle of the text that will be drawn. |
|
Draw leader line with gap |
Check this to add a leader line when a gap has been used. |
|
Clear visualization layers |
Check if you want the layers to be cleared before adding new data. |
|
Include data prefix |
Check this to add a text prefix to each data value that is visualised. |
|
Data and prefixes |
Check on the required data values you wish to display and adjust the prefixes that are used. Easting Delta Northing Delta Horizontal Delta Chainage Delta Offset Delta Elevation delta |
|
Colors |
Choose the colour of the conformance text to be displayed on screen. |
