Run a Surface Area Report
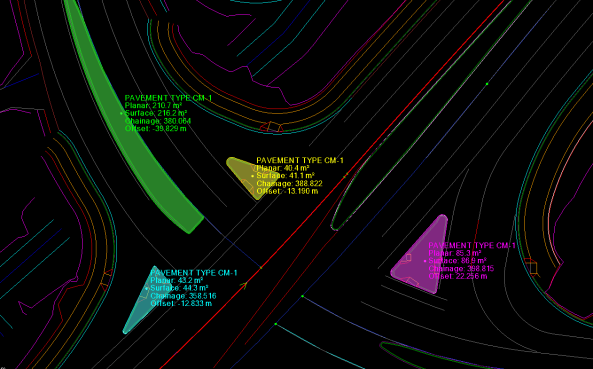
 TheSurface Area Report Tool command enables you to select a surface and boundary or multiple boundaries to calculate Plan and Surface Areas. It displays the shaded boundaries and areas on screen, and can write the text to a user-defined layer and to an Excel report.
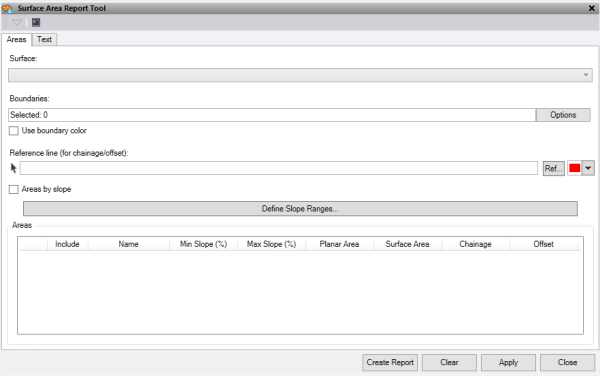
- In the Areas tab, pick a Surface to report against.
- Select the closed polygon Boundaries to determine the areas.
Note: These must be closed Line strings or Boundary polygons.
- Check Use boundary color to use the colors of the polygons, or leave unchecked to use random colors.
- Optionally, click Reference Line and then select an alignment string in the graphic view. This enables you to adjusg the chainage of the centroid of the area shown as text on screen. To use a line from a Reference file, press Ref. Optionally, change the selection highlight Color.
- Select Area by slope to show the surface's area separated into ranges of slope, as specified in the Define Slope Ranges dialog.
The area in each range is shown as both planimetric and surface area. Each surface triangle, as a plane, has a slope. The areas of triangles whose slopes fall within the same range are combined and reported in the table. If, for example, the range limits are 0, 5, 10, and 20, the report will group and report surface triangles whose slopes (in %) are from 0 - <5, then 5 - <10, 10 - <20, and 20 - ¥.
- Click Define slope ranges to redefine the slope percentage ranges used to report areas by slope.
- Click Apply to calculate the areas and display them on screen and in the text box.
- Uncheck any boundaries in the text box that you do not want displayed on screen and in the report.
- Click Create Report to send the data in the text box to an excel report.
- Click Clear to clear the text box.
- Select the Text tab to draw the measurements taken and recorded in the measurement tab to text.
- Define the Layer. A layer called Text – SurfaceAreaReportTool is automatically created.
- Choose a Color
- Choose a text Style
- Enter a text Height
- Enter a Gap between the location and the start of the text.
- Check Draw area polygons to create filled linestrings of the visualisation.
- Press Create Text to create text from the data in the Areas Text Box.
- Press Clear Layer to delete all data from the layer defined above.