Run a Baseline Processing Report
After you have processed baselines in your project, generate a Baseline Processing Report to view a complete summary of the process and detailed information about each processed baseline. Use these reports to determine which baselines need to be disabled or investigated further, and which settings may need to be adjusted before reprocessing.
Note: This report is also one of several reports with a predefined template that you can modify to create a new custom report. See below.
To generate and save the report:
- Optionally, select the processed baselines you want to include in the report.
If you do not select any processed baselines, all processed baselines are included in the report.
- To generate the report:
- Select Baseline Processing Report.
- With baselines, vectors, or a session selected, right-click, and select Baseline Processing Report from the context menu.
Optionally, if you have just processed baselines in your project and the Process Baselines dialog is still open, you can view the Baseline Processing Report for any of the observations listed. Select the row in the Processing Results list, and click the Report button.
Depending on your selection in the View in drop-down list in the Report Options command pane (see below), the report displays either on the Report View tab or in a Web browser window.
You can click any link in the report to select the linked object in Trimble Business Center.
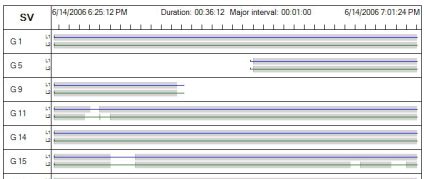
The Baseline Processing Report includes a "Tracking Summary" section in which a plot indicates the quality (number of cycle slips) and continuity of the tracking of the L1, L2, and L5 signals received from each satellite. Each blue (L1), green (L2), and red (L5) horizontal line indicates that data was available for that frequency for the specified satellite during the time period indicated. Shading on a line indicates the data was used for processing during that time period. Each short, black vertical line indicates a cycle slip on the carrier.
The report also identifies the
 mode automatically selected for baseline processing.
 - To save the report, do one of the following:
- If you are viewing the report on the Report View tab, click the Save icon on the tabtoolbar and select to save as an Excel spreadsheet file, Acrobat PDF file, or Word file.
- If you are viewing the report in a Web browser, use the browser's File > Save As feature.
Note: This is the only way to revisit a report without regenerating it.
To change report settings:
- Select Reports > Report Options in the Quick Access Toolbar.
- In the Reports list, select Baseline Processing Report.
- In the Settings section, select options as necessary.
The View in drop-down list allows you to select whether to display the report on the Report View tab or in a Web browser window.
- When you are done, click the Apply or OK button.
To create a custom Baseline Processing Report from a template:
If you want the report to include different data or a different layout, follow the steps in Create and Edit Customized Report Templates.
