3D Viewer
One of the primary objectives of any monitoring system is to understand movements and respond promptly when they exceed limits. T4D offers various ways to present movement data to stakeholders, including tabular views, different types of charts, maps and more. T4D has introduced an innovative 3D Viewer functionality. This feature allows users to visualize sensors and their displacements directly on a 3D model, represented as a TrimBIM file, providing a more intuitive and comprehensive understanding of movement data.
About TrimBIM File Format
TrimBIM is a file format developed by Trimble to optimize upload/download times and facilitate seamless model interaction. TrimBIM (*.trb) efficiently stores 3D BIM/Civil geometry and attributes, providing fast in-memory random access and offering a smarter way to work with model data. It significantly accelerates model-based processes and enables the same model to be used across different Trimble applications.
The TrimBIM file is also supported in T4D for visualizing sensors and displacements in 3D space. To ensure accurate sensor placement on the model, the TrimBIM file must be in the same coordinate system as the T4D project.
Creating a TrimBIM File
Trimble develops, implements, and maintains the TrimBIM file format, which is utilized across various Trimble software applications such as Trimble Connect, Trimble Business Center (TBC), Quadri, Tekla, and Trimble Access. The following two paragraphs describe how to get a TrimBIM file from Trimble Connect and TBC.
Trimble Connect
A free and straightforward way to create a TrimBIM file is by using Trimble Connect, a Trimble cloud-based collaboration platform. It is available in various business models, including Personal, Business, and Business Premium. While the Personal plan is free, offering 1 project with 10 GB of storage, including features to create a TrimBIM file, the last two are subscription-based. To create a TrimBIM file, open Trimble Connect, create a new project in your region, upload a model you want to save as a TrimBIM file and open it in the Trimble Connect 3D Viewer. From the Models section, click on the three dots next to the uploaded model. A window opens with an option to download as TrimBIM file. Select this option to save the TrimBIM file to your local computer for further usage in T4D's 3D Viewer.
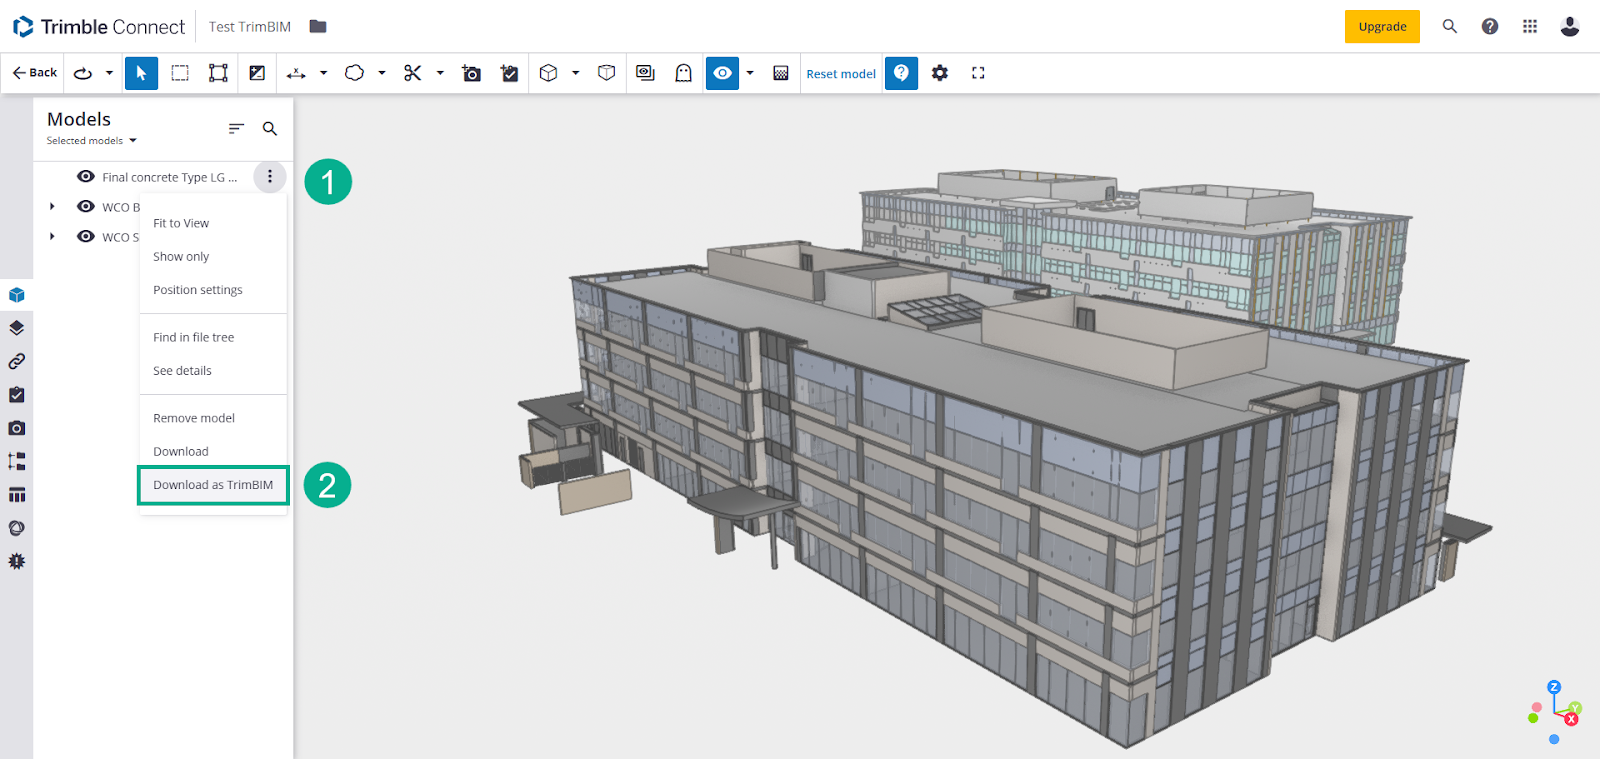
Saving a model as a TrimBIM data type from Trimble Connect
Here are some common model file types that can be uploaded and saved as a TrimBIM file:
-
IFC (Industry Foundation Classes)
-
DWG/DXF
-
SKP (SketchUp model files)
-
RVT (Revit model files)
-
DGN (Version 8)
-
LandXML (Version 1.2)
Model files can vary widely in attributes and may be generated from various software solutions before being converted into the final formats mentioned above. This process can lead to inconsistencies with the supported model file types mentioned above.
Trimble Business Center
Trimble Business Center (TBC) also enables users to upload model data, export it as a TrimBIM file, and to georeference the model if it is not already in the appropriate coordinate system. First identify the points on the model and the corresponding points in the TBC project with the right coordinates, then use the Edit options in the CAD tab and proceed to move and orient the model. Once the model is in the correct place, proceed by exporting for usage in the 3D Viewer of T4D Web. Select the model to be exported in TRB format, then the data to be exported as a TrimBIM file, and finally save it as a TRB file. TBC supports the IFC (Industry Foundation Classes) and DWG/DXF as model data types that can be exported as TrimBIM files.
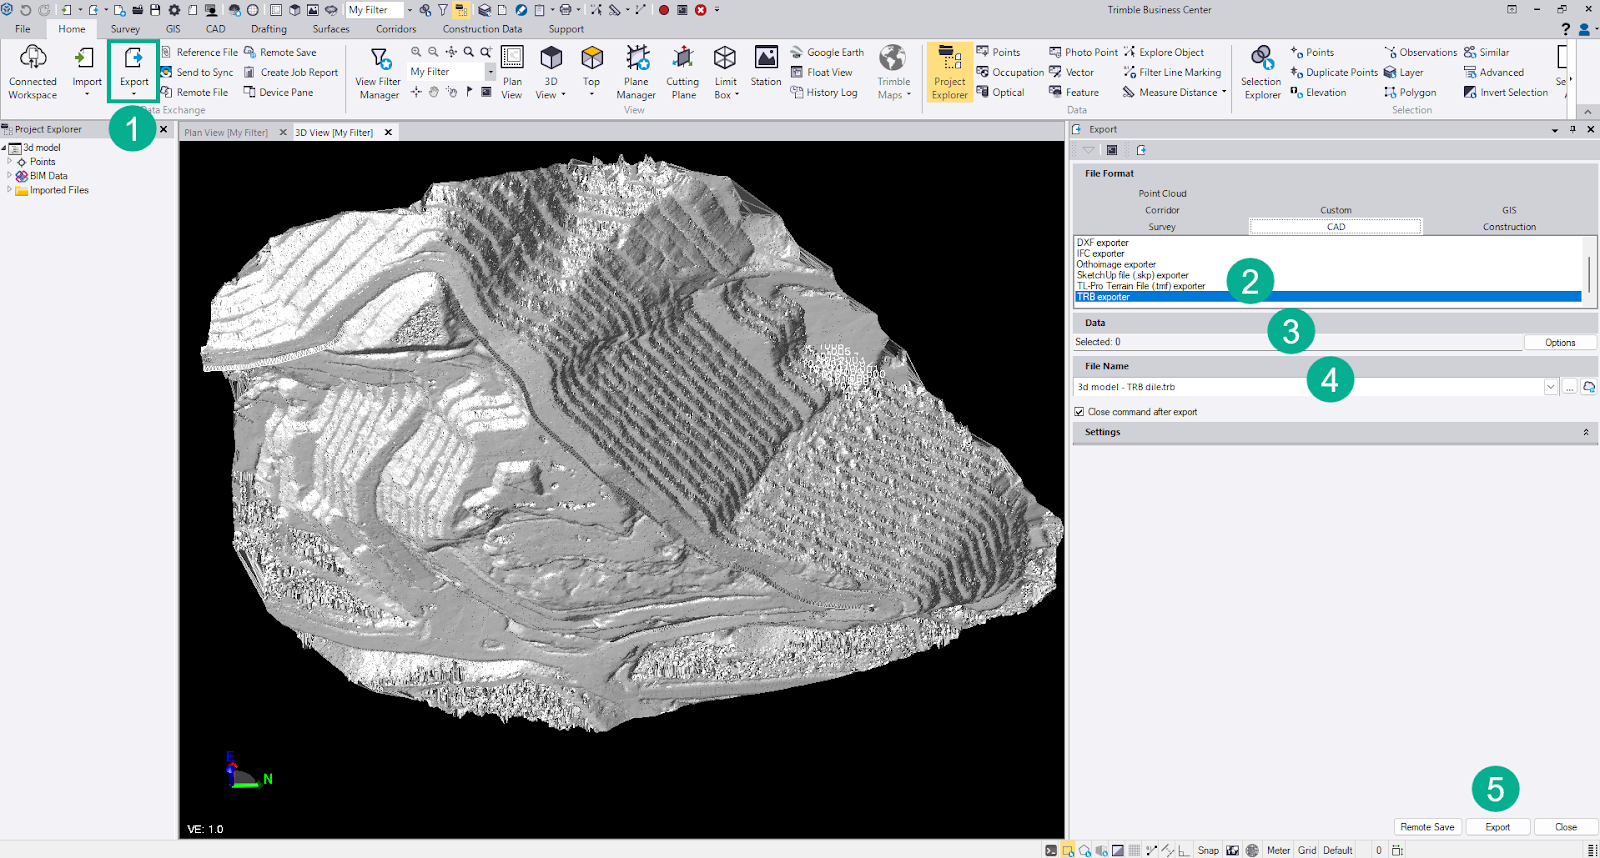
Saving a model as a TrimBIM data type from TBC
Other Trimble Software
Other Trimble software where TrimBIM files are being used and can be saved include Quadri (see here), Tekla (see here), and SketchUp.
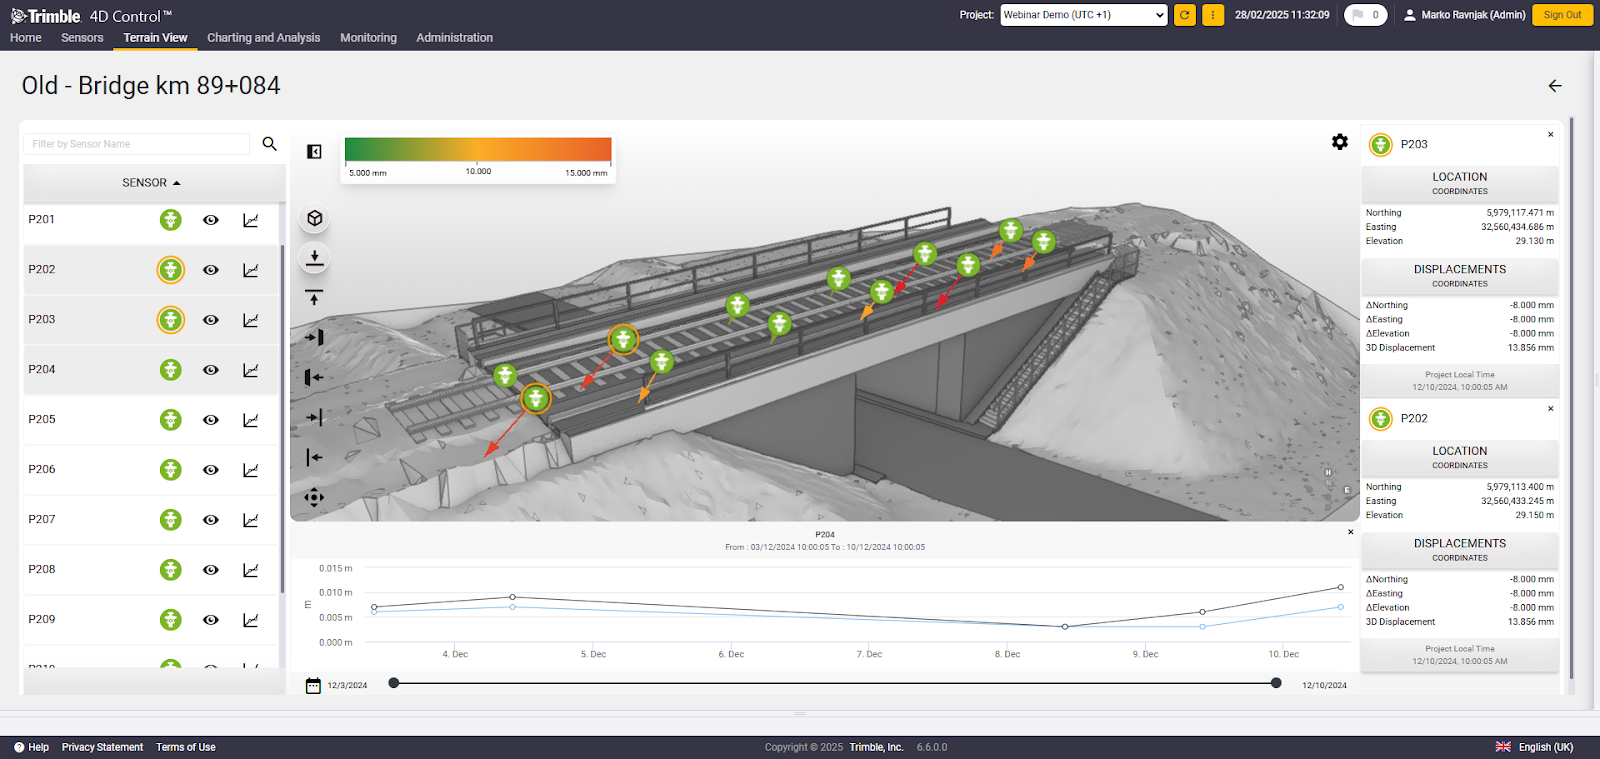
Visualizing a Model in 3D Viewer
To visualize sensors and displacements on a 3D model, open the 3D Viewer in T4D Web under Terrain View. Users with previously analyzed models will see a list to select and revisit them. If an update to an existing model in a 3D space is necessary, click on the edit button to replace the model or change the name.
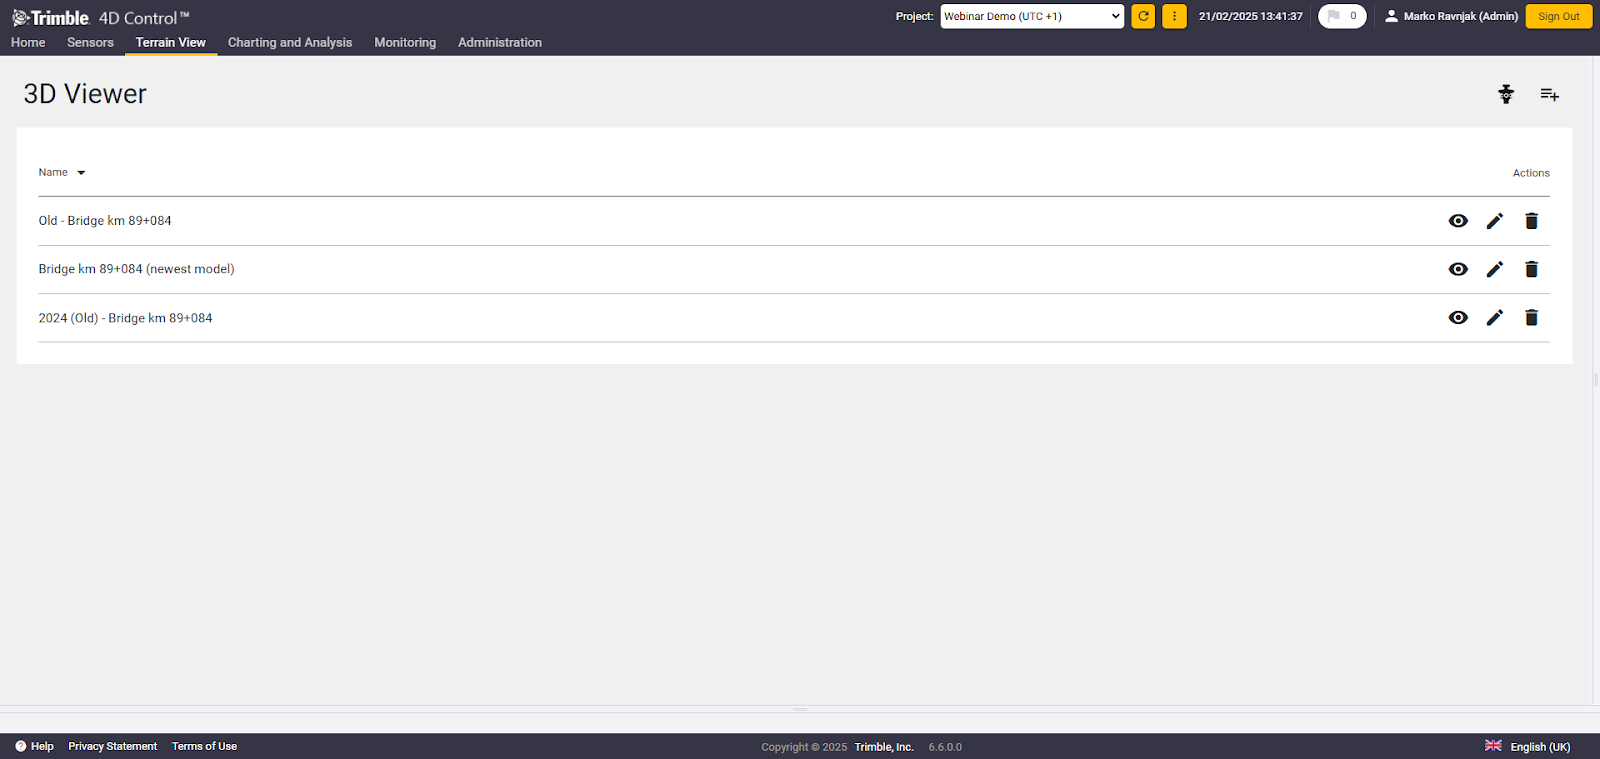
3D Viewer landing page with 3 examples created
Users can also choose to visualize sensors and displacements without the model if desired. This will show sensors and vector displacement in an empty 3D space to help visualize movement in 3D. To continue viewing sensors without the model, click on the prism icon in the right top corner on the landing page (see figure above).
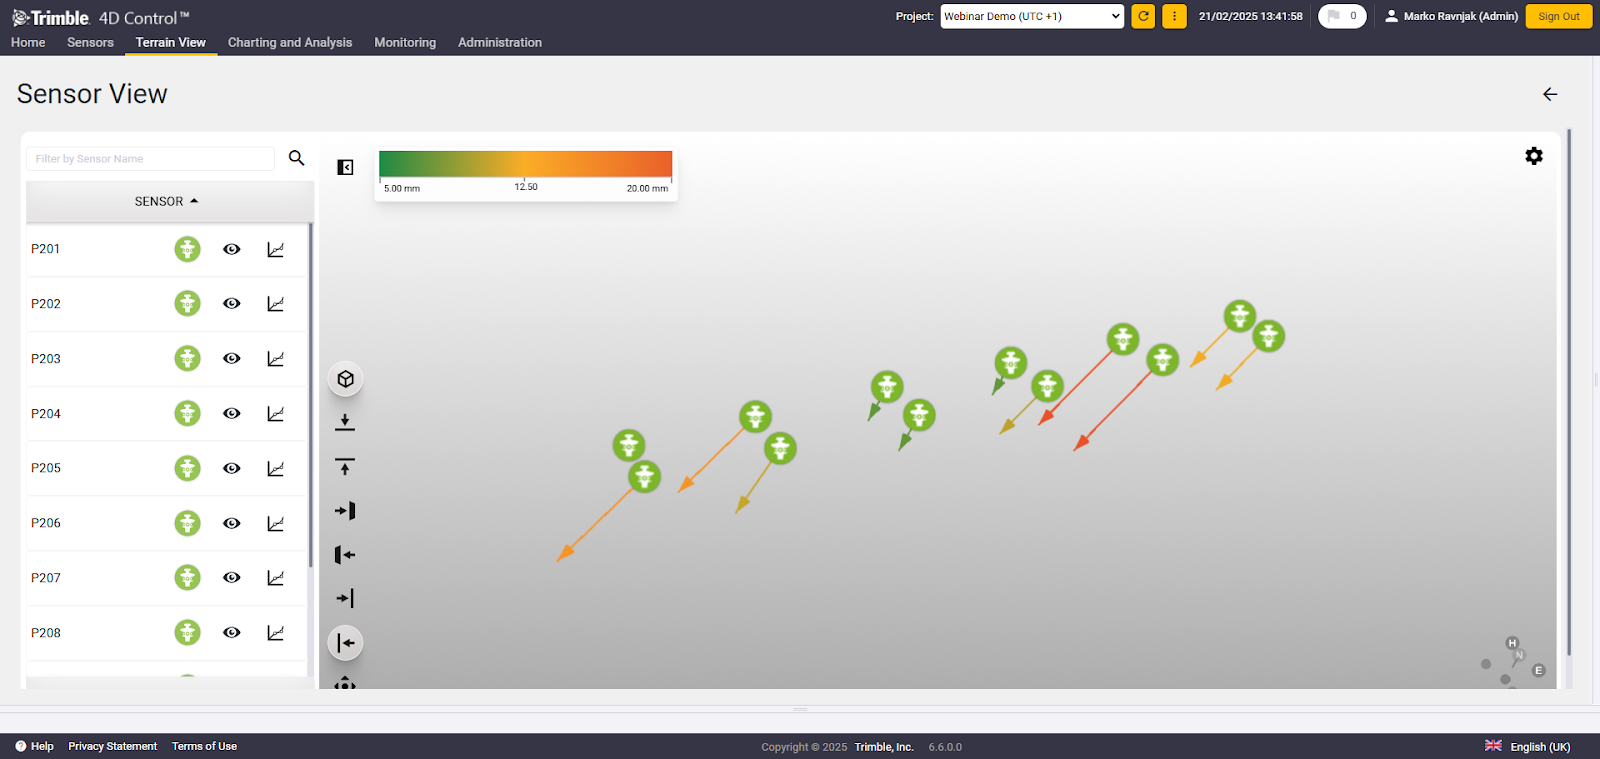
Sensors and vector displacements in 3D space
To add a new model to the project in T4D Web, select the + icon on the top right corner. This opens a page where you can upload the model and save it under a specific name. By default, the model name is used, which can be changed. Once the model is uploaded, a View in 3D button appears, allowing you to view the model in the 3D space, along with the sensors in that project. If the sensors are positional sensors, vector displacements will also be displayed.
3D Viewer Functionalities
In the 3D Viewer, analyze the model, sensors, and 3D-vector displacements from different angles by rotating and zooming in and out of the model. The icons on the bottom left side allow the selection of different views: top or bottom view, left side, right side, front or back view, and an axon view from an outside perspective where the whole model is presented. In this panel, users can fit the view to the model's coordinate limits. This is particularly useful when there are sensors outside the model that should not be visualized, as it will exclude those sensors from the view.
On the left side of the view, sensors are listed with the option to filter sensors. In the sensor list, select a sensor to open the sensor information window with the last available data presented. A sensor can also be selected directly on the model and the selected sensor is marked yellow. Multiple selection is possible. The 'eye' icon hides or displays the individual sensors and the chart icon next to it opens the chart for that specific sensor.
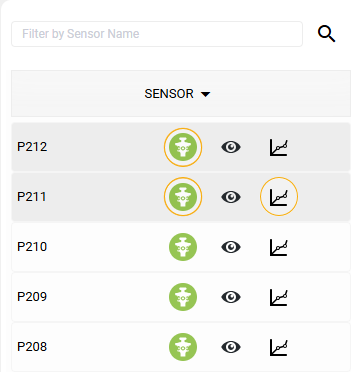
Sensor and chart selection in the sensor list
The chart opens below the model and displays how values change over time. The Time window can be adjusted using the time/date slider or time and date can be set manually by selecting the calendar button on the right side of the chart. Hovering over a specific value displays values for that time stamp.
3D Viewer
On the top right side of the screen, a settings button allows further adjustments to the model and sensors.
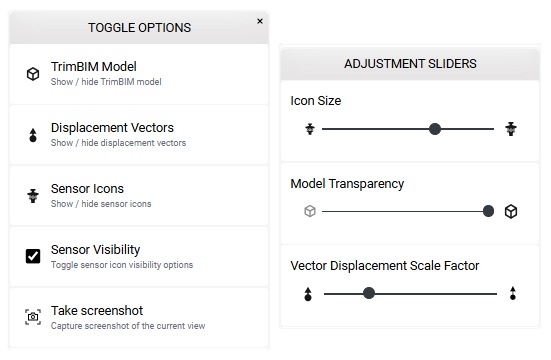
Toggle and adjustment options
-
TimBIM Model - Allows you to hide or show the model.
-
Displacement Vectors - Toggle the visibility of displacement vectors.
-
Sensor Icons - Show or hide sensor icons.
-
Sensor Visibility - Toggle between two sensor visibility options. When "Sensor always visible" is enabled, sensors will be displayed regardless of the view. If disabled, sensors that are, for example, beneath the model will not be visible in specific views, such as the top view.
-
Take Screenshot - Capture the current view of the 3D model. This functionality is ideal for documenting and sharing specific views from the 3D Viewer. To take a screenshot, click on the screenshot icon in the 3D Viewer. The screenshot will be taken and saved locally.
In addition, the adjustment sliders allow the user to adjust model transparency, sensor icon size, and vector displacement scale factor.
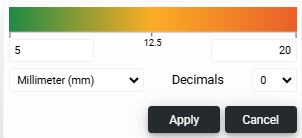
Displacements shown are color-coded to indicate the severity according to a color scale. Users can edit the following display parameters on the legend:
-
Minimum displacement threshold - displacements below this threshold will not be shown.
-
Maximum displacement threshold - displacements above this threshold appear in red at maximum length/size.
-
Unit of measure and decimals
For 3D visualization and positional sensors, sensor data is in 3D and uses both the height and 2D measurements to calculate displacement. Displacement is visualized using an arrow, with the length and color of the arrow indicating the severity of the displacement.
Displacement Vector Scale
-
Geotechnical sensors must have defined grid coordinates to be displayed on the 3D model.
-
Geotechnical sensors cannot display displacement vectors, as this feature only applies to positional sensors.
-
You can place sensors manually on the map for georeferencing purposes when using a local coordinate system. During this process, approximated geographical coordinates are assigned to the sensors. However, these approximated coordinates are not converted to grid coordinates or used for 3D visualization.
