Cross section analysis
The Cross Section analysis chart plots particular observation values from different sensors opposed to a distance axis. There is no restriction on the value columns that can be plotted on a Cross Section analysis.
A Cross Section analysis is very similar to a non-cumulative Tiltmeter array analysis plotted on the same chart. The distance between sensor observations on the distance axis can either be a user defined distance or the distance between the sensors automatically calculated from the sensor locations.
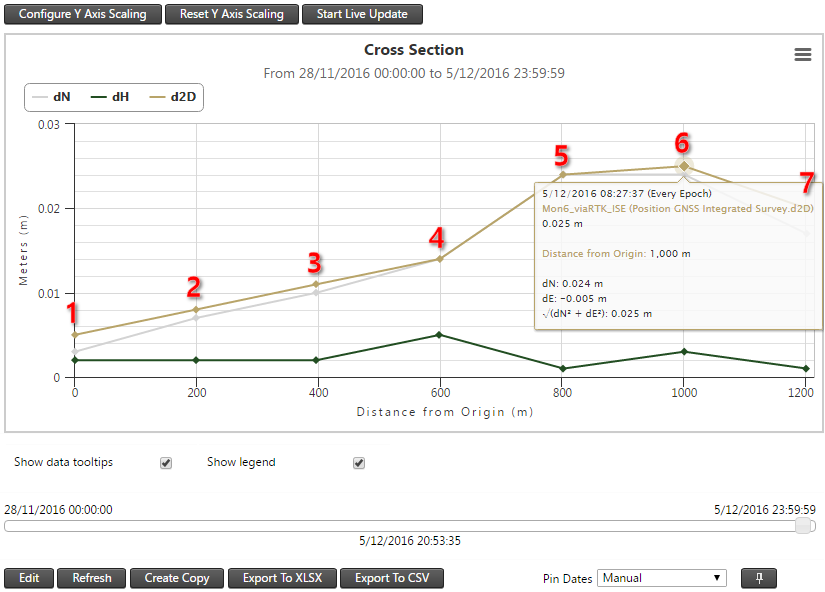
The Cross Section analysis above plots the dN, dH and d2D observations against the distance between the seven position sensors (the Segment Length Mode was selected as Calculated NE).
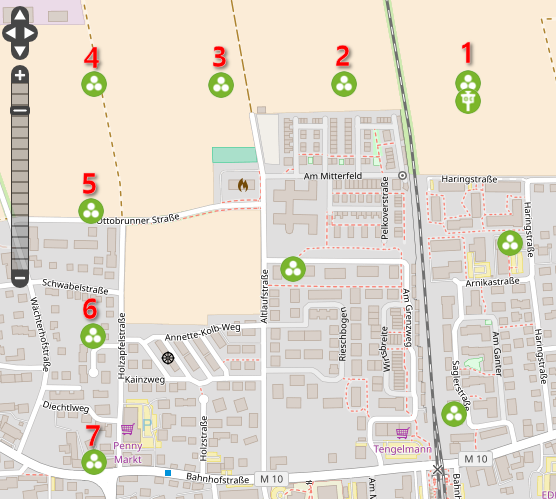
The locations of the seven position sensors are indicated on the map below. Moving the date slider on the Cross Section analysis will show how dN, dH and d2D on the different sensors vary over time.