Tabular analysis
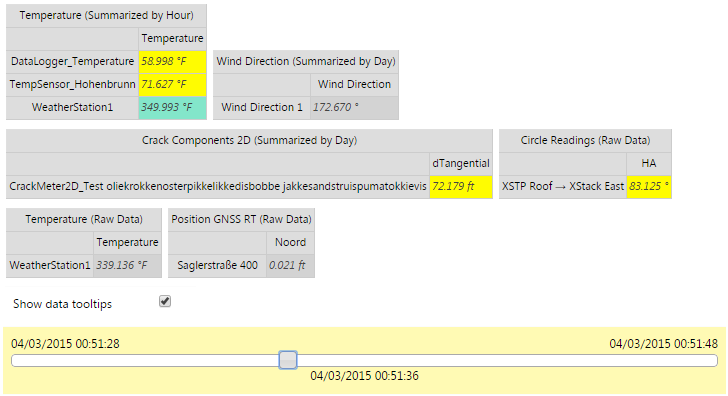
A tabular analysis groups data type components of different sensors together in tables and shows the various measurements on a single page. This is helpful to correlate observations between different sensors.
Use the date slider bar to scroll through the observation time period to visualize the observation changes over time.