Analysis view
To view the analysis, click the Analysis icon in the Analysis list on the left or click the View button .
This topic discusses the features specific to the normal chart analysis and some general Analysis features. For general information about the charting feature in Trimble T4D Control Web, refer to the Charts section.
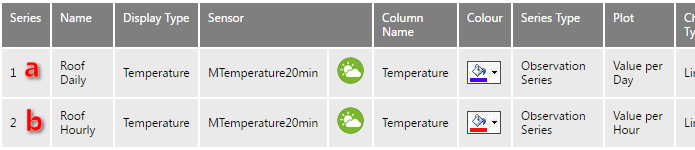
The analysis shown below has three Analysis Series, each from the same Sensor Data Value Column:
-
The raw sensor measurements are temperature readings every 20 minutes.
-
The Analysis Series (a) is configured to be a Value per Day summarized data set.
-
In the Analysis View, all sensors are plotted on the same graph.
-
Notice the plot band on the chart background surface that we previously configured in the Analysis series plot band settings section.
-
Analysis Series (a) shows the reduced amount of data as value per day was selected.
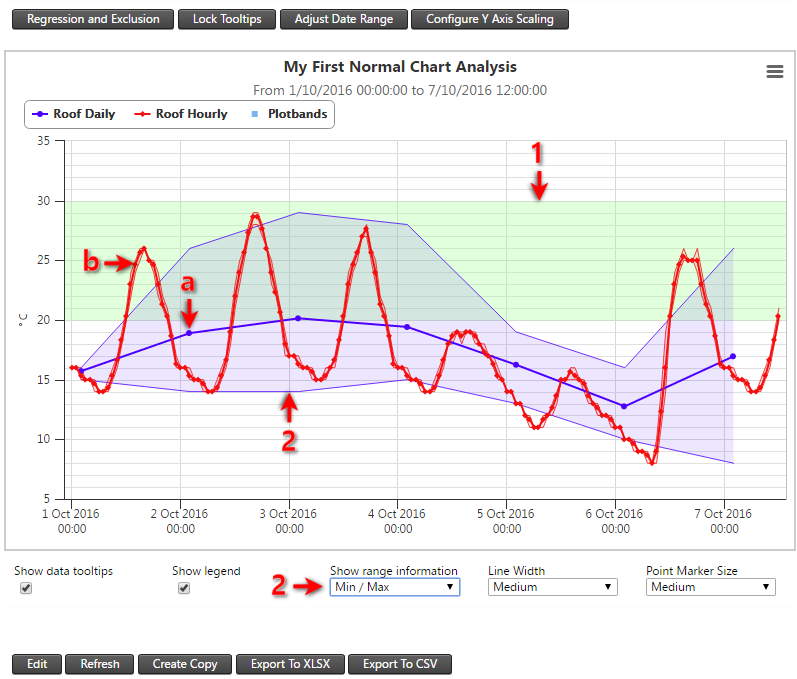
Chart options
-
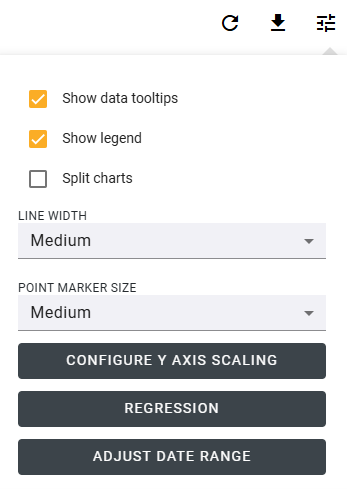
Show data tooltips - Displays a popup with detailed data values when hovering over points in the chart.
-
Show legend - Shows a legend identifying each series in the chart with its corresponding color and label.
-
Split charts - Separates multiple series into individual charts for easier comparison and clarity.
-
Define line width and point marker size - Adjusts the thickness of plotted lines and the size of markers for each point to improve visual readability.
-
Configure Y-Axis Scaling - Use Lock Y Axis Scaling to fix the Y-axis scale based on the current chart. When selected, the Y scale is preserved between zoom operations on the same sensor chart; when cleared, the Y scale recalibrates with each zoom operation.
-
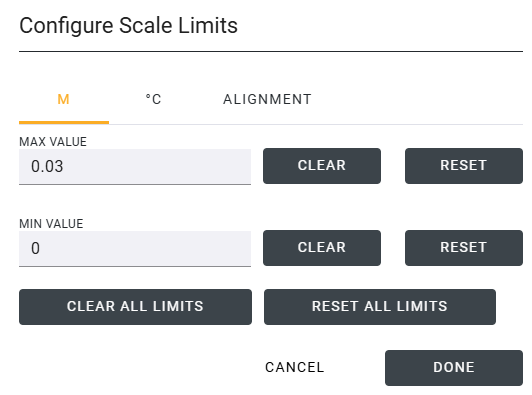
Configure Y-Axis Scale Click the Configure button to show the Configure Scale Limits dialog. A tab is shown for each Y-axis in your chart, allowing you to set Min and Max values for each Y-axis. Once defined, these values are always shown on that Y-axis.
-
The Alignment tab allows you to align the tick marks across different Y-axes. When enabled, the actual Min and Max values may differ from the configured values, as the chart adjusts them to ensure tick lines align. If Align Ticks is disabled, horizontal tick lines are hidden for aesthetic purposes.
-
