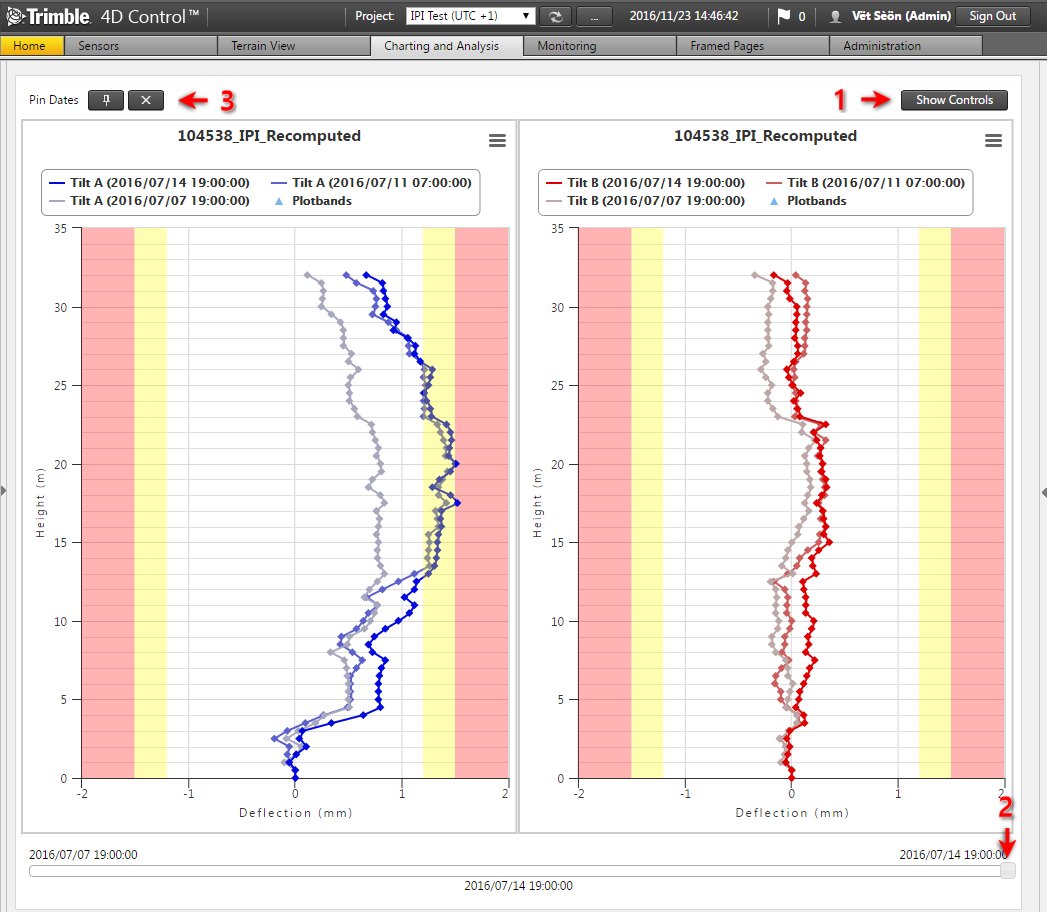
View IPI chart
To view an IPI chart, select an IPI sensor from the View Sensor page and click the IPI Chart button.
The example below shows a Relative plot of an IPI chain in a Bottom Up orientation. A number of controls are available on this view:
-
Click the Show Controls button to expand the controls area (see below).
-
The date slider at the bottom of the page can be used to animate the state of the primary series over time. Click and drag this slider to set the data and time that should be depicted by the primary series.
-
The Pin Dates controls are visible if the current Pin Date Mode is set to Manual.