Map data overlays
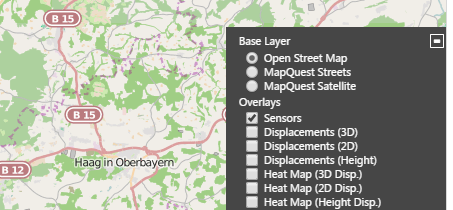
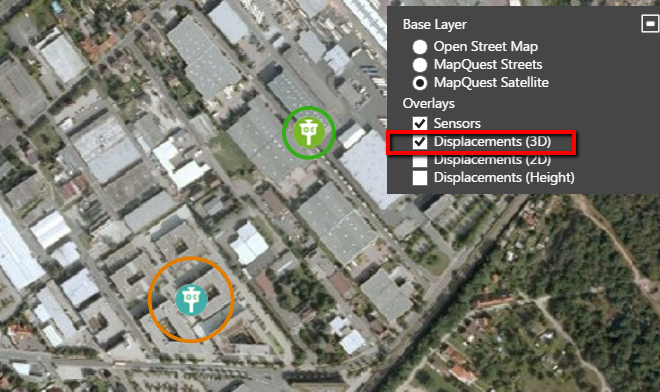
Use the Overlay settings at the top right of the map area to show and hide available sensor layers.
Sensors overlay
The Sensors overlay displays sensor icons at the projected sensor location on the geographic map.
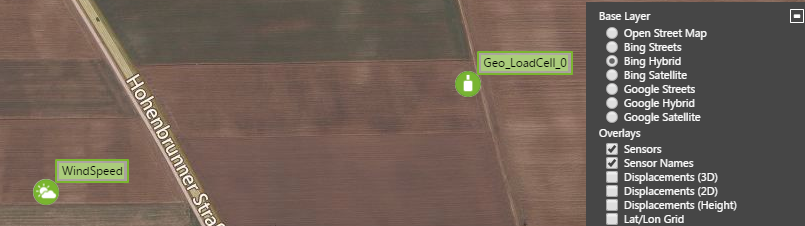
Sensor Names Map overlay
Select the Sensor Names overlay to display the names of sensors on the map. The sensor name labels may be grouped together, depending on the map zoom level.
Displacement Vector Map overlay
In addition to the Sensors overlay, you can show the displacement of sensors visualized as a displacement vector layer. The displacements shown are color coded to indicate the severity of the displacement according to a color scale.
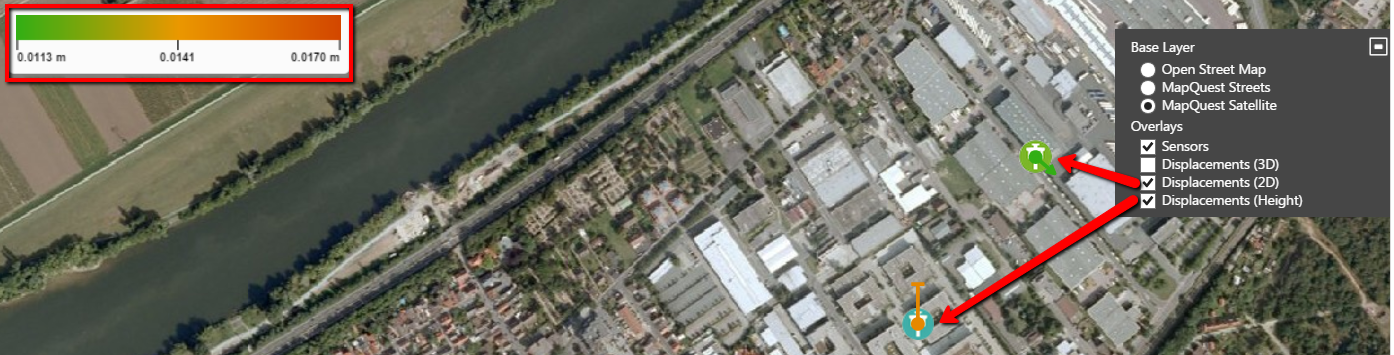
A legend of the color scale is also included to the left. The legend appears only if a displacement overlay is enabled.
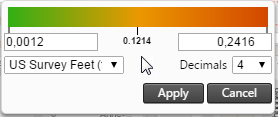
You can edit any of the following display parameters on the legend:
-
Minimum displacement threshold: Any displacement below this threshold is not shown.
-
Maximum displacement threshold: Any displacement above this threshold appears in red at maximum length/size.
-
Unit of Measure: Change the unit of measure (if multiple units are available for the particular metric)
-
Decimals: The number of decimal places to be used when displacement values are displayed.
A sensor that measures Height (in the map above for example the orange bar), shows the direction of the displacement by use of a bar pointing up or down and the severity of the displacement as the length and the color of the bar.
A sensor that measures 2D (in the map above for example the green arrow) shows the direction of the displacement by use of an arrow and the severity of the displacement as the length and color of the arrow.
A sensor that measures 3D will use both the Height and 2D measurements to calculate a circle around the sensor and show the severity as the radius and color of the circle, as shown below. The direction of 3D displacements are not visualized here. The radius of the circle is equal to the 3D displacement vector length.
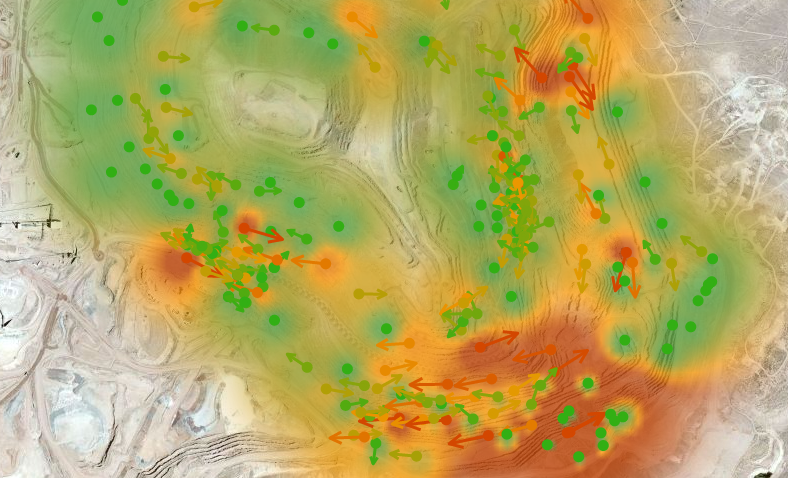
Displacement Heat Map overlay
In addition to the displacement vector layer, you can enable the Displacement Heat Map overlay which visualizes the various vector displacement layers using interpolated color maps.
The color map is color coded with the same color scale as the vector displacement layer.