Release notes 6.4
These release notes describe the features and enhancements that are new in version 6.4 of Trimble® 4D Control™ (T4D) software.
Overview
Through providing an automated movement detection solution, T4D software supports surveying and construction professionals in making informed decisions about earthen and civil structures.
T4D provides benefits in four key areas:
-
Sensor management & data integration—for GNSS, total station, geotechnical, vibration and environmental sensors.
-
Geodetic processing & adjustments—for accurate and reliable results from a combination of sensors through network adjustments and integrated processing engines.
-
Analysis & visualization—through a set of comprehensive visualization, charting and analysis tools that provide real-time updates to support in-depth analysis and data presentation.
-
Alarming & reporting—with conditional and project-specific alarming to provide up-to-date notifications to key stakeholders.
For further support information, visit the Product Information webpage and Support & Downloads sections at the bottom of the T4D product page.
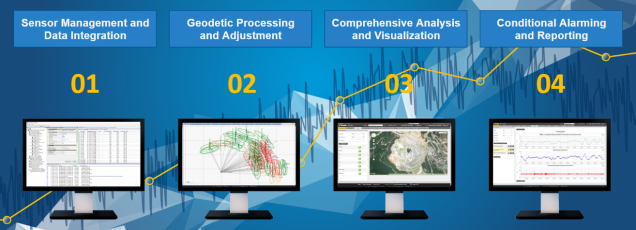
Four key areas of T4
T4D Rail module
Introduction
Version 6.4 of T4D introduces an innovative add-on rail-specific monitoring solution for automated monitoring.
The new rail-specific monitoring module is an add-on to a licensed edition of T4D. All rail specific functionality, including alarms and exports, is encapsulated in a newly added Rail Monitoring section.
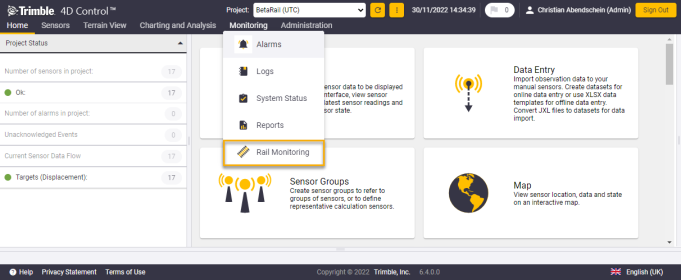
New Rail Monitoring section at T4D Web
Please find an overview of the key features in the following and have a look at the T4D Rail monitoring user guide for more detailed information.
Purpose and benefits of rail monitoring
Rail monitoring is becoming increasingly important in the modern environment, with a fast-growing demand for energy efficient modes of transport. The rail module allows monitoring of the most crucial rail track geometry parameters, which helps maintain high rail safety standards.
It helps ensure rail traffic can continue when there is construction activity, either under the track or in the vicinity of the track. Rail monitoring is also recommended when there are occurrences of natural hazards—such as heat waves or tectonic movement—as well as in areas where infrastructure is old and susceptible to erosion.
The purpose of rail monitoring is to record railroad track geometry before, during, and after the completion of nearby construction or to make sure that the track geometry stays stable if there are impacts from natural hazards. If the track has been adversely affected, the data can be used to alert the stakeholders to take appropriate action and reestablish the existing design.
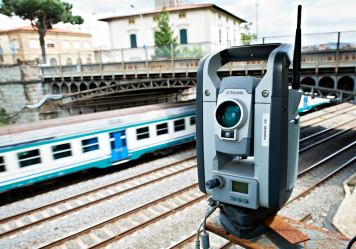
Total station monitoring the rail infrastructure
Rail track parameters
The most important parameters of rail track geometry are the following:
-
Cant—height difference between the inner and outer rail.
-
Twist—change of cant over a certain length.
-
Vertical displacement—height difference between the current height and the height of the reference measurement of the rail track center line.
-
Horizontal displacement—side movement perpendicular to the rail track center line compared to the reference measurement.
-
Vertical versine—versine of an arc as defined by three consecutive height positions along the rail track center line.
-
Horizontal versine—versine of an arc as defined by three consecutive horizontal displacements along the rail track center line.
Additionally, the user has the possibility to display and monitor the Observation age of the measurement. Observation age is calculated as the time between the current calculation date and the date of the latest available measurement of a certain prism.
Total station and prism rail monitoring
Total stations (see Figure #3) and prisms are often required by rail authorities to operate as sensors for rail monitoring activities. The total station measures the prisms that are: glued on the rail, mounted or fixed on the rail, established as “rail clamps” or installed on the sleepers (see Figure #2). T4D is capable of calculating all relevant rail parameters regardless of the method the prisms are installed.
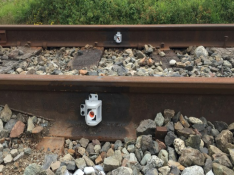

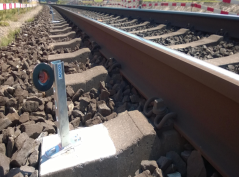
Prisms deployment examples - glued on the track, rail clamp fixed on the rail, prisms installed on the sleeper (From left to right)
As-built survey in the field required for proper rail monitoring
The main challenge in rail monitoring applications is calculations of the rail parameters that refer to the actual rail track geometry while total stations measure to the prisms. On top of that, another challenge is that the lateral and vertical offsets vary between monitoring prisms and rails and are not identical for every prism deployment.
This is why an as-built survey is a prerequisite for proper rail track monitoring. The result of an as-built survey is a 3D representation of the rail track which in combination with the coordinates of the monitoring prisms can be used to calculate the lateral and vertical offsets between the rail tracks and the installed prisms. Having the offsets allows the calculation of the rail parameters in relation to the rail track itself instead of the prisms.
There are two ways to do the as-built survey and collect the necessary data for the rail monitoring project. Regardless of the method preference of as-built survey creation, the result is a representation of the rail track geometry, called *.track file.
Trimble Access Track Gauge Survey app
The first solution is using the simple, cost-effective Trimble Access application called the Track Gauge Survey. This solution lets the user capture the as-built survey using the track gauge bar and measure the installed monitoring prisms.
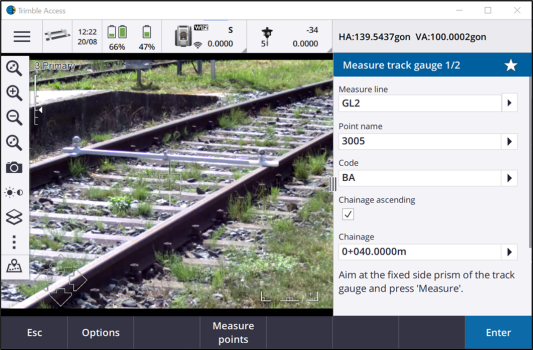
Measurement window in Trimble Access Track Gauge Survey app
GEDO measurement system
The other option for capturing the track position and geometry data is to use the GEDO measurement system in combination with the Trimble Access Rail - GEDO Rec Trolley app or GEDO Track software. The *.track file must be exported from the GEDO Office software.
Rail Module key features & benefits
Significant time saver both in the office and in the field
The new T4D Rail module simplifies the data collection and reduces up to 95 percent of the office work required to automate movement detection for the rail monitoring project.
Trimble provides a quick and efficient way to do as-built surveys of rail track using the field solutions described further up in this document. The new rail module seamlessly integrates the accurate rail as-built results collected with these Trimble field solutions and allows users to start the monitoring process almost immediately as offsets between the rail track and the installed prisms are automatically calculated.
![]()
Rail monitoring workflow using the Trimble Access Track Gauge Survey app
On top of the seamless integration with the field results, the T4D Rail module automatically configures a rail section and prevents users from doing this manually.
Rail section concept opposed to pure prism monitoring only
A rail section in the T4D Rail module represents a rail track in the field. Instead of monitoring individual sensor measurements against thresholds, the module combines data from multiple sensors to model and monitor the behavior of a real-world object including, in this case, the rail section.
This behavior is represented by the rail track geometry parameters, calculated using the measurements of the prisms installed on the sleeper/rail, which follow the specifications defined by the rail authorities
Rail section status information at a glance
Rail section status gives the user the overview of the last available values of every monitored parameter for every chainage. The values are colorized according to the defined thresholds. Only the parameters, which are set to be monitored, are shown. By looking at the severity level, a user can easily see the chainages that are affected by parameter changes.
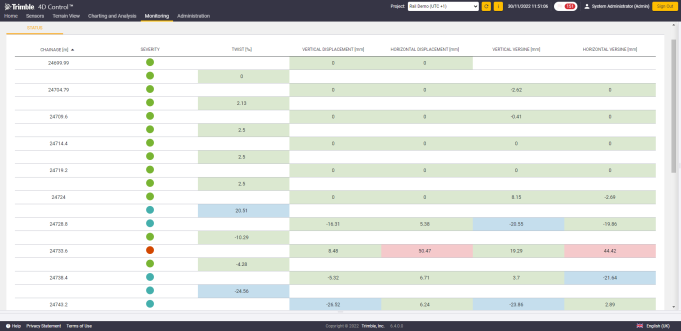
Rail Section status window
Rail parameters visualized and/or monitored in accordance with project requirements
The user has the flexibility to choose the parameters necessary for the rail monitoring project depending on the country and project specifications. Additionally, if a parameter must not be monitored and reported, its values can still be shown in the charts. In this case, only the show button should be enabled (see Figure #8).
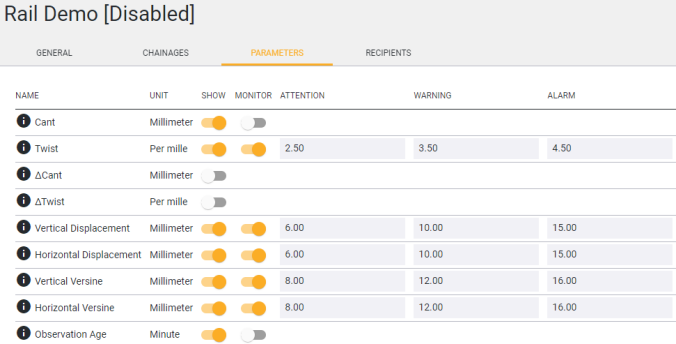
Selecting the parameters and defining the thresholds
Rail-specific visualization allows for meaningful and intuitive analysis
There are two different chart types users can set up to visualize the calculated values of the rail track geometry parameters on a chart:
-
Chart over chainages—signals which chainage area of the rail sections of the track are concerning
-
Chart over time—quickly see the points in time when the unwanted change in parameter began occurring.
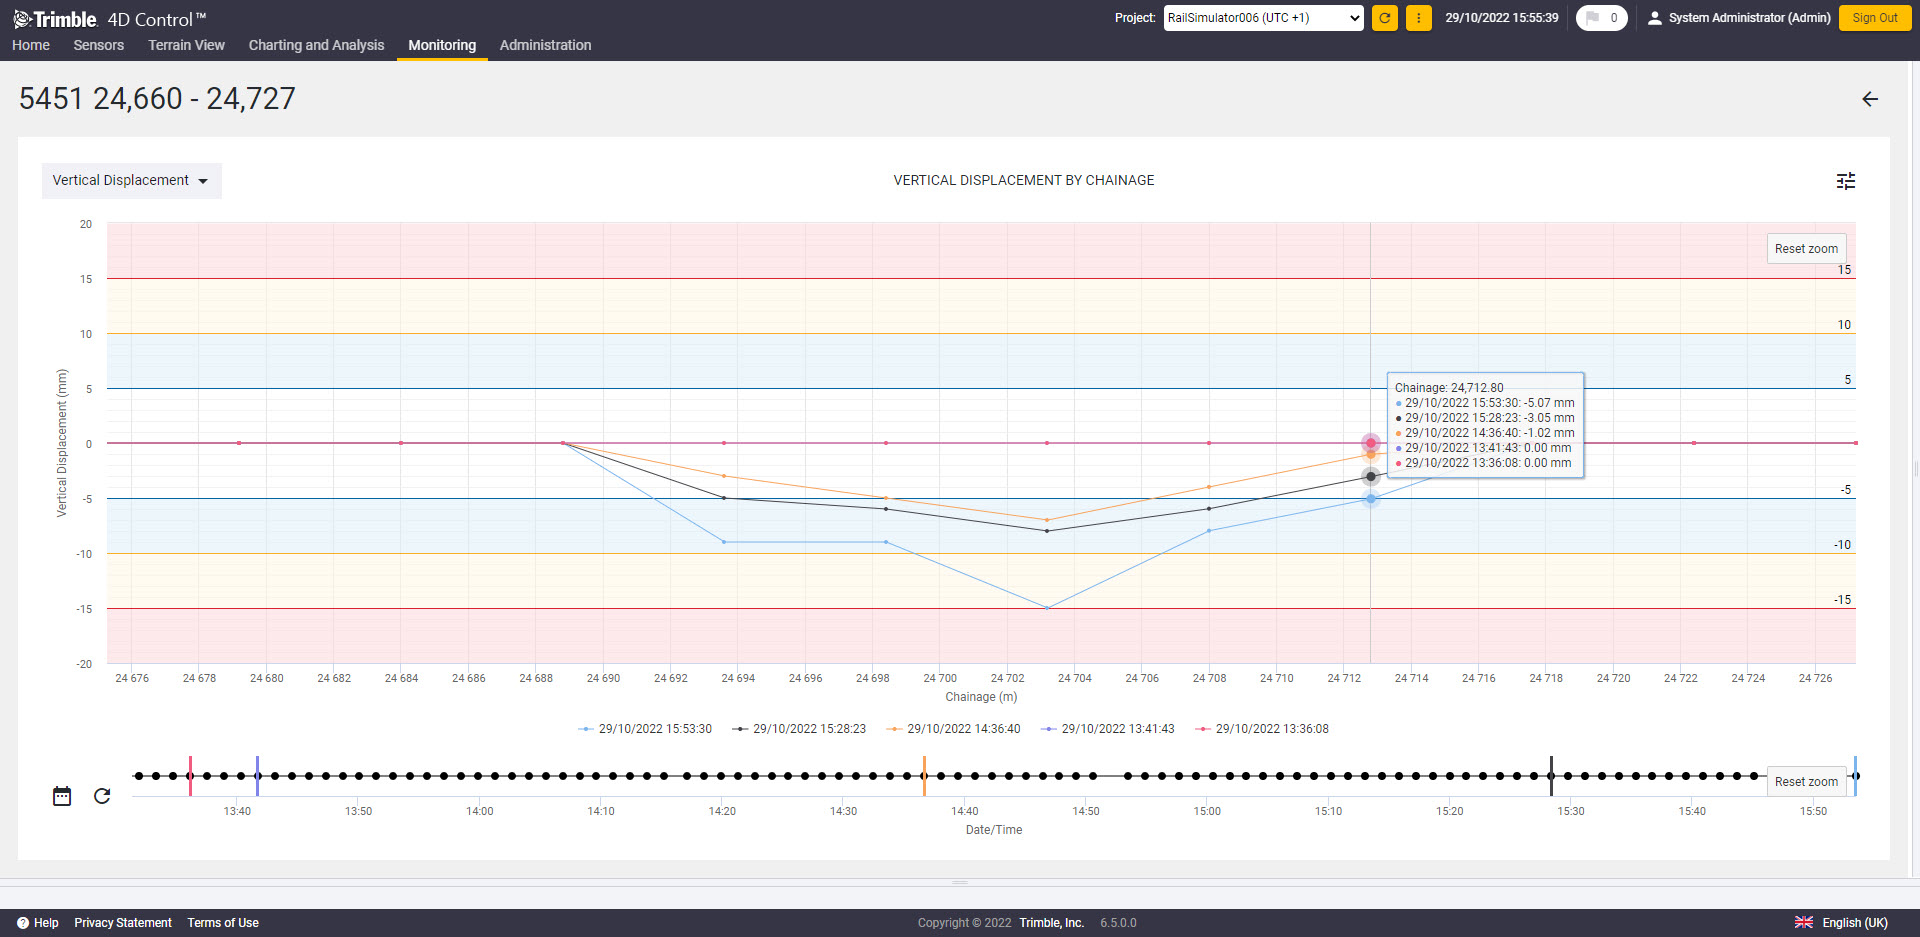
Chart by Chainage
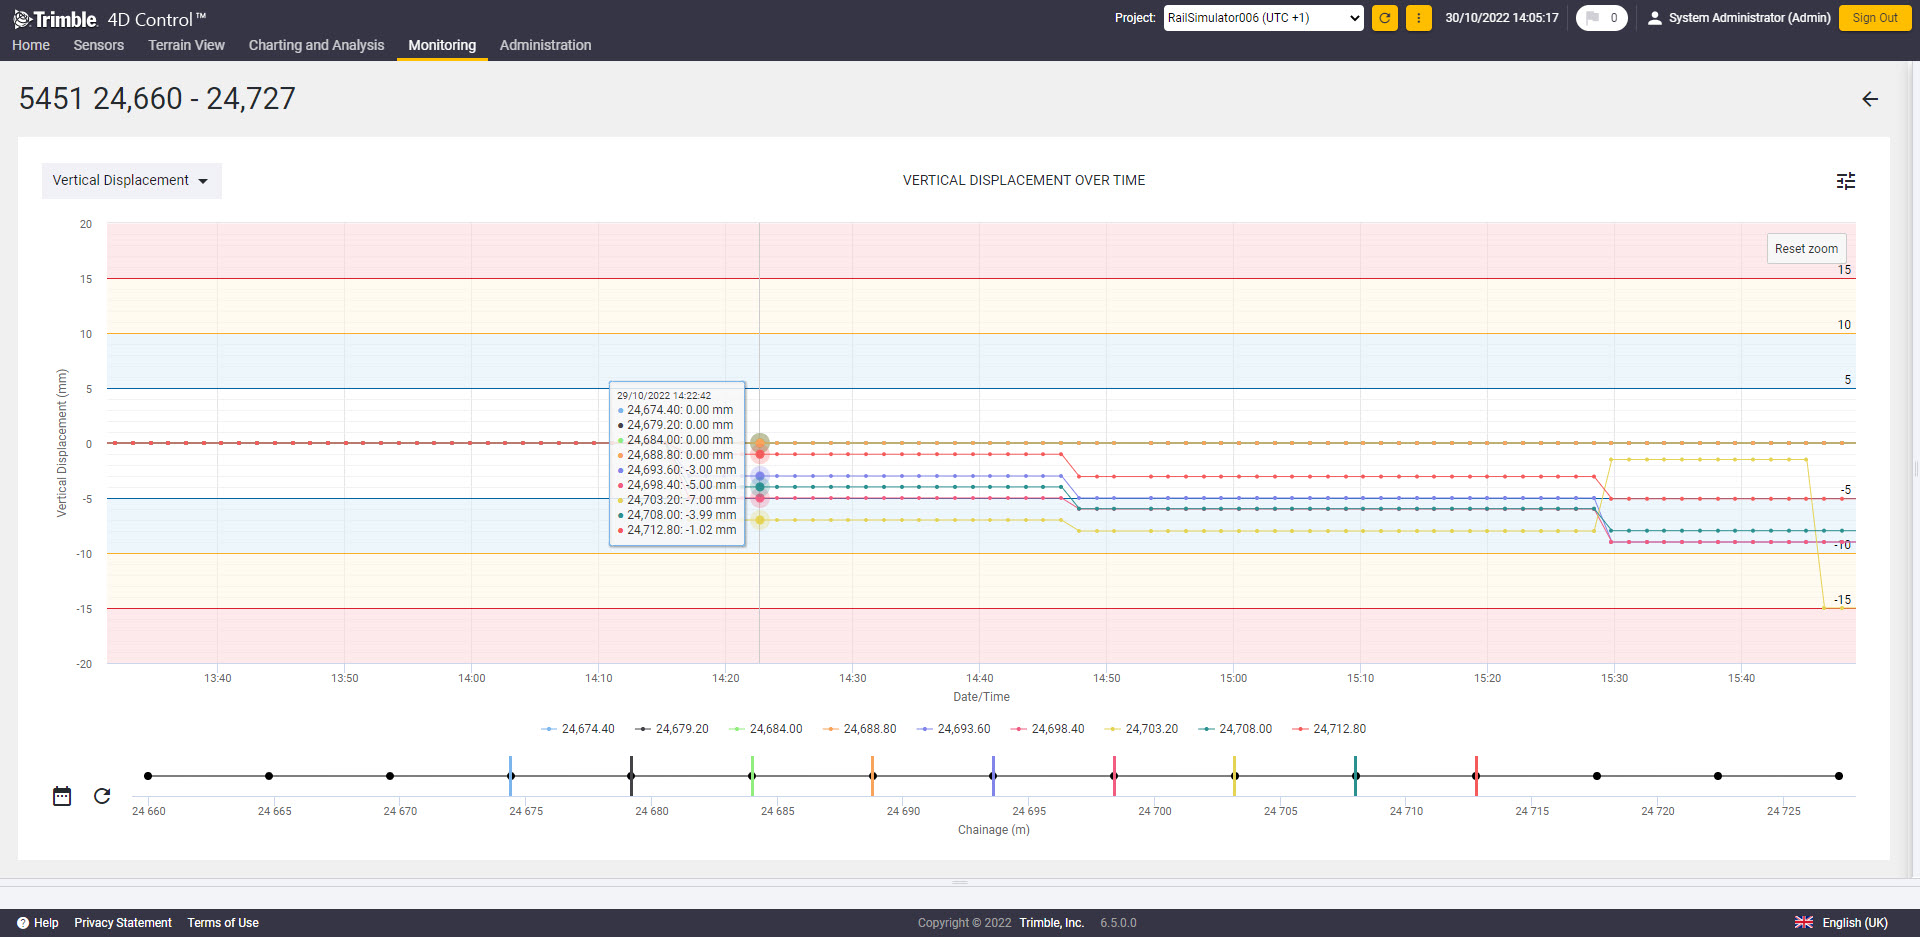
Chart over time
Alarm on exceeded rail parameter thresholds via Email or SMS
Suppose one of the defined thresholds for any rail parameter or the rail section is exceeded. In this case, an attention, warning, or alarm will be triggered, and the user will get a notification via email or SMS. A number of recipients can be associated with every rail section.
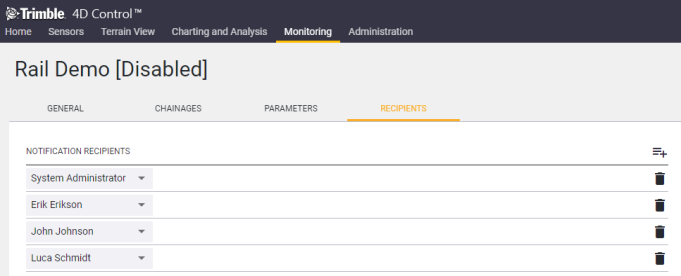
Recipients window
Export calculated rail parameters (*.xlsx file) for further usage
All calculated rail track parameter data can be exported in an *.xlsx file for a specified time range and may be further used for e.g., reporting, analyzing or further processing. Same as with the Rail Section status view values are colorized in accordance with the defined thresholds. Only parameters that are enabled for monitoring are shown.
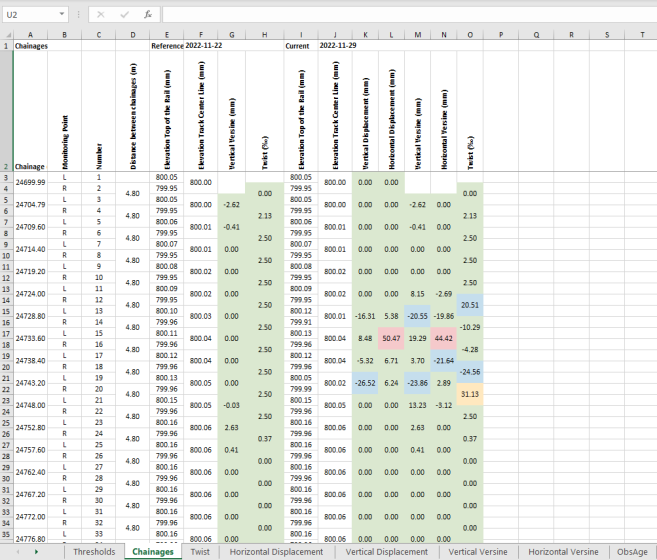
Overview of selected calculated rail parameters at a glance
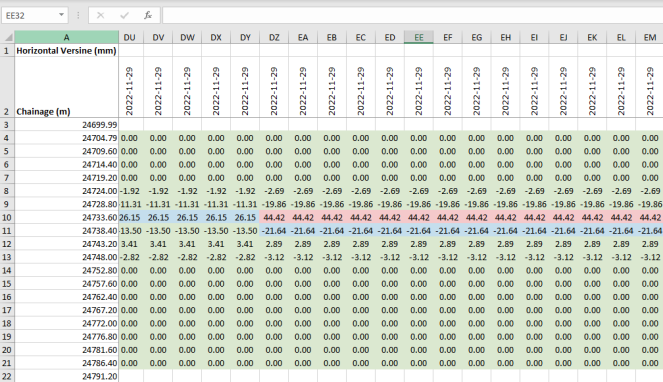
Example of calculated horizontal versine for the specified time range
T4D version 6.4 enhancements
1. Sensor management & data integration
T4D Control offers users the ability to utilize a single platform for comprehensive automated movement detection. The robust software solution allows you to manage many different sensors and integrate many different data types on a single platform.
Non-Trimble total station data and Settop M1 data post processing through GKA files
Total stations, from any manufacturer, used for automated monitoring are now supported by T4D software. If customers want to start using T4D to automate their movement detection, they no longer need to wait in order to start reaping the benefits of T4D.
In order for the data from a third party total station to be integrated into T4D, and processed by the Terrestrial Engine PP, the data needs to be available in the accepted GKA convention. The convention specifies the file format, naming requirements, and the folder structure. The data can be either manually uploaded to T4D or T4D can scan a specified and accessible folder and automatically read in new data.
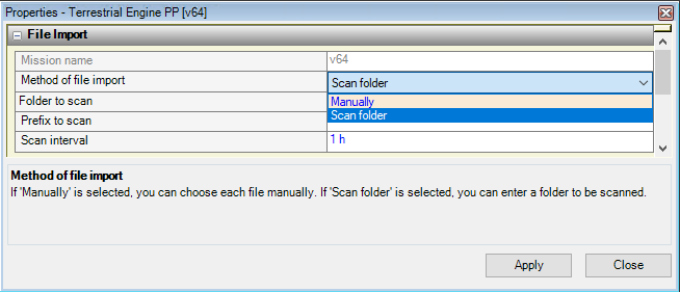
File import methods of Terrestrial Engine PP
The acceptance of GKA files by T4D also allows for the Terrestrial Engine PP to process data collected through automated Trimble total stations in environments where the fully automated monitoring workflow is not applicable for reasons such as network restrictions. In these environments users can remotely download their automatically collected data (in the form of GKA files) from the Settop M1 user interface and then manually transfer the files through secure connections to the monitoring server. With this additional support, monitoring projects that require internal networks can still benefit from automated data collections and T4D capabilities.
Control points in the GKA file need to have coordinates so the GKA file can be successfully processed by Trimble 4D Control. Coordinates of control points are automatically contained by exported GKA files if the initial site setup has been performed using Trimble Access Monitoring and transferred to the Settop M1.
Licensing rework for geotechnical gateway sensor count
Now, the licensing limit related to the number of sensors is only relevant to the number of sensors that are currently actively monitored and associated with a T4D Web project. The sensors are only counted once even when they are used within multiple T4D web projects.
If a license limit is exceeded, a message will pop-up to inform the user about the licensing situation. The user will be prevented from monitoring additional sensors, however the synchronization process for all configured gateways will continue as normal. In order to free license counters, a user can delete sensors from web projects. Sensors linked to multiple projects must be deleted from every project.
Rework of ephemeris download
The IGS provides their products, namely final, rapid, and ultra-rapid orbits and clocks, only with new, long file names. The Ephemeris Download module therefore now supports downloading all orbit types also with these new file names.
The precise orbit feature now allows downloading the new files with longer names and the associated section at the module properties now also includes the configuration option to download ultra-rapid (predicted) orbits. For that purpose, there is a new property 'Include predicted orbits' that is visible and enabled by default after the upgrade to this version.
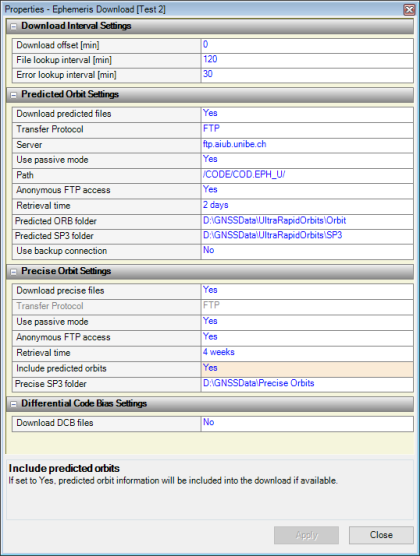
Include predicted orbits
2. Geodetic processing & adjustments
The robust geodetic processing power of T4D Control also offers value to users. It can simultaneously perform real-time and post-processing runs of total station and GNSS data and on top of that execute integrated network adjustments.
Trimble CenterPoint RTX Post-Processing
T4D now has an option to monitor post processed GNSS RTX positions. The RTX-PP engine sends the stored raw GNSS receiver data (e.g., RINEX data) to the Trimble CenterPoint® RTX™ Post-Processing service and the processed and adjusted positions are automatically sent back to T4D for further visualization and analysis purposes. The service calculates corrections with respect to precise orbits of GNSS satellites. The session duration can be specified in T4D (up to 1 day).
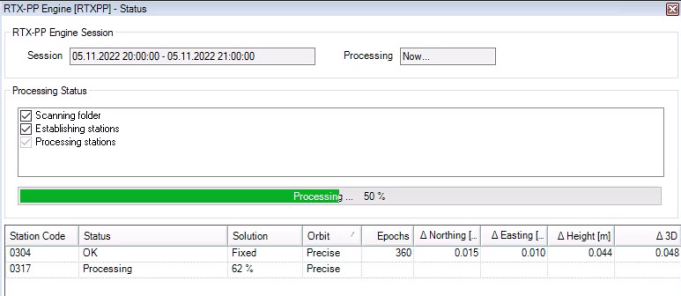
RTX-PP engine processing results
The RTX-PP engine system is beneficial for monitoring applications where accurate relative GNSS positions cannot be processed due to long baselines like on an offshore drilling platform. RTX-PP based monitoring can also be used for position monitoring of GNSS receivers that are used as reference stations as they are supposed to not move.
3. Comprehensive analysis & visualization
T4D supports informed decision-making by providing multiple data visualization options, configurable analysis, and real-time data updates.
Coordinate monitoring for automated positional sensors
T4D allows the automated monitoring of coordinates for both target sensors and GNSS sensors. Before, alarm thresholds could only be based on the magnitude of displacement for automated positional sensors. T4D version 6.4 allows users to set thresholds based on specific coordinate values.
Monitoring coordinates instead of displacements can be beneficial for monitoring projects that are in a local coordinate system where the Northing and Easting coordinate components are related to important features on the construction site such as a building being constructed in line with the Northing and Easting axis.
To enable coordinate monitoring, make sure that when the sensors are created within T4D, that the data type Coordinates is enabled. Integrated Survey data type or Terrestrial displacements data type need to be enabled as well. In addition, alarm thresholds can be based on 2D and 3D and/or d2D and d3D relative movement.
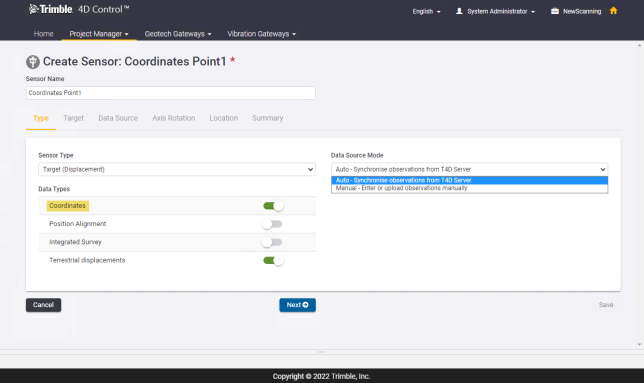
Data type coordinates
mm/m as display unit for angular units
T4D allows monitoring of angular values, tilt information, in the unit millimeter per meter (mm/m). If the unit preferences for the angular unit at the project settings is set to millimeter per meter, angular displacements—on a time series—are visualized in mm/m, with the corresponding scale bars on the side also being in the unit mm/m. This feature allows users to report on, for example, tilt sensor changes in mm/m instead of degrees or radian.
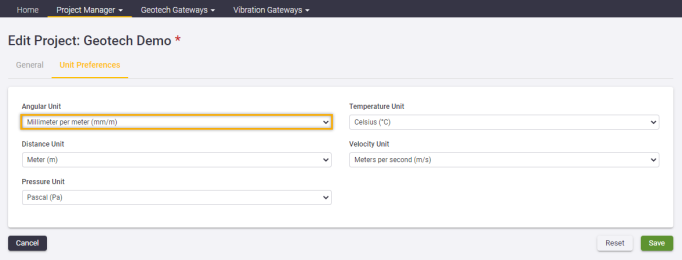
Unit mm/m
4. Conditional alarming & reporting
One of the key functionalities of T4D is allowing users to automate scheduled reports and alarm notifications to ensure important information about the project site is communicated to all relevant stakeholders on and off site in a timely manner.
Ability to download T4D Web reports
All the generated PDF reports sent out via mail are now also listed at the bottom of the report schedule page. Users can login to T4D Web and simply pick the pdf report of interest and download it from there. The report is then stored at any specified directory for further usage.
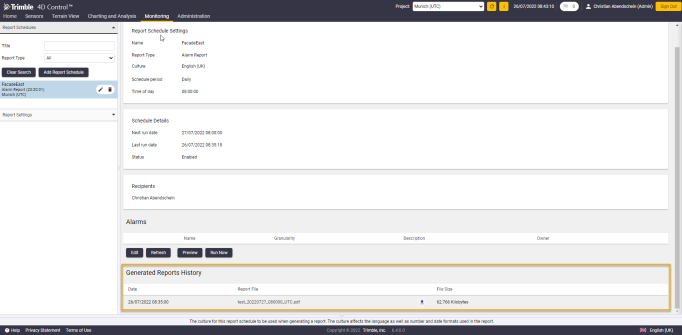
General Reports History
Coordinate Exporter enhanced by optionally including reference coordinates and statistical information
Statistical information and reference coordinates have been added to the Coordinate Exporter properties as additional output options. This addresses the need of T4D Field users of being able to export more information associated with the coordinates of a current epoch.
In particular, statistical information in the shape of standard deviations as a result of the geodetic processing next to the actual coordinates generates accurate analysis abilities of the exported data.
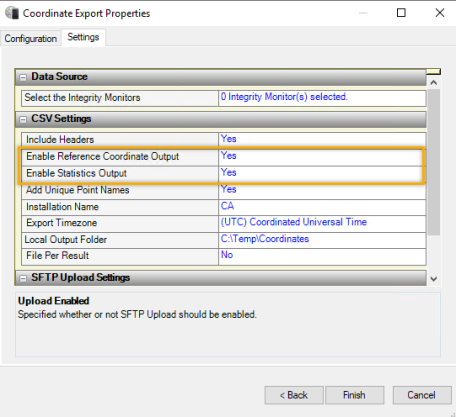
Reference coordinates and statistics output settings of Coordinate Exporter
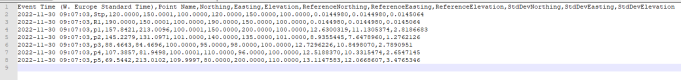
Sample of an exported .csv file
General improvements
Additional features of T4D version 6.4 not discussed in the above material are outlined below. The implementation of the Solution Improvement Program and updating the patch application procedure are two overarching improvements to the software platform.
Solution Improvement Program
The Trimble Solution Improvement Program collects information about errors that might come up for users and information about T4D usage overall. Trimble uses this information to improve the product and features used most often to better meet the user needs.
Participation in the program is strictly voluntary and a user can opt out at any time. If a user chooses to participate, the T4D log file is automatically sent to the Trimble server once every 24 hours. The file includes data on what the software is being used for, what functions are popular in specific geographical regions, and how often problems occur in T4D that we can correct.
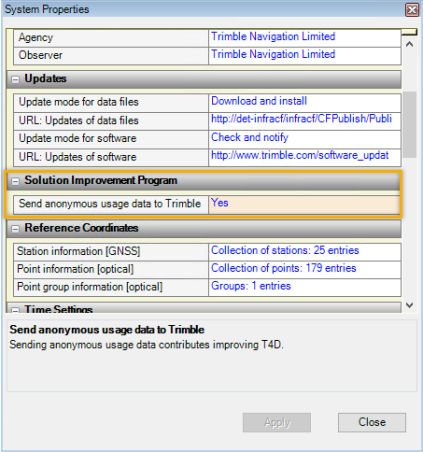
Solution Improvement Program
Updated patch application procedure
T4D version 6.4 offers a new method of applying a software patch. The notification method in T4D Server remains the same in terms of informing users about the availability of an updated version. The software update icon turns blue at the bottom bar if there is an update available.
Future software patches come in the form of a full installation. This means that, when applying a patch, the current version of T4D is uninstalled and a newer version of T4D—that includes the latest changes—is then automatically installed.
Resolved issues
The following changes have been made to resolve issues in the previous releases:
-
A scroll bar has been added to the site setup dialog in case the scaling did not allow for the OK and Cancel buttons to be visible.
-
The process of downloading images and geodetic observations from Settop M1 has been improved by, for example, enabling observations to be downloaded separately from images in case of low bandwidth.
-
Consistent visualization of data in the GDA/AGD coordinate system throughout the T4D system.
-
Enabling Coordinate Exporter to upload files to more restrictive SFTP servers.
-
MongoDB windows service is now also monitored by the Trimble Service Administrator (TSA), so it is automatically restarted in case it unexpectedly stops running.
-
When configuring a calculation sensor, specifying a reference sensor is now required to prevent meaningless configurations .
-
The T4D Server Alarm Manager now includes an email ID when sending email notifications. This is a requirement for some email providers.
System requirements
T4D v6.4 supports the following operating systems, SQL servers and browsers.
Operating systems
-
Microsoft Windows Server 2022 (July 2022) *New
-
Microsoft Windows 11 *New
-
Microsoft Windows Server 2019 (October 2018)
-
Microsoft Windows Server 2016 (September 2016)
-
Microsoft Windows 10
SQL servers
-
Microsoft SQL Server 2019
-
Microsoft SQL Server 2017
-
Microsoft Azure SQL Server
Trimble highly recommends using a full Microsoft SQL edition, such as the Standard or Enterprise edition, in order to avoid limits in memory capacity and performance. This is particularly critical for monitoring systems with many sensors and processing engines where T4D Intermediate or T4D Advanced is used.
Browsers
Google Chrome is a prerequisite for generating T4D Web reports and is automatically installed with T4D if it was not already available.
Installation procedure
To install Trimble 4D Control, please perform the following steps:
-
Have the Microsoft SQL database administrator credentials available for the installation of T4D Intermediate or T4D Advanced.
With regard to the software editions T4D Access, T4D Field, and T4D Geotechnical, Microsoft SQL Express 2019 will be automatically downloaded and installed.
-
Run the Trimble 4D Control installer executable that is available from the Trimble Monitoring website (monitoring.trimble.com).
Note that the installer offers a “Download Media” option for an offline installation on a different server that has no internet access. In this case the installer downloads the entire set of installation files for all software editions.
-
Select the Trimble 4D Control software edition relevant to the license acquired and wait for the installation files to be downloaded.
The installer only downloads the installation files of the selected software edition.
-
Follow the instructions of the installation wizard.
Upgrade procedure
To update the software from a previous version to version 6.4, please perform the following steps:
-
Ensure that the existing installation of Trimble 4D Control is running on version 6.3. If not, please update to version 6.3 first.
-
Back up all Trimble 4D Control configuration files (*.tde) using the “ConfigurationImportExport” tool that is available from the Trimble 4D Control Server installation directory.
-
Create a database backup (*.bak) using the Microsoft SQL Server Management Studio.
-
And then create a MongoDB database backup. More information can be found on the mongodb.com website.
-
Run the installation of Trimble 4D Control version 6.4. The installer automatically detects and uninstalls version 6.3, before proceeding with the installation of version 6.4.
Please contact monsol_support@trimble.com for assistance with the upgrade, if needed.
For more information, contact your local Trimble Distribution Partner.
This is the December 2022 release (Revision B) of Trimble® 4D Control™. It applies to version 6.4 of the software.
