System Status report
To add a new System Status Report, on the Report Schedule page click the Add Report Schedule button, select System Status Report and then click Create.
The System Status Report options are shown below the Report General Settings section.
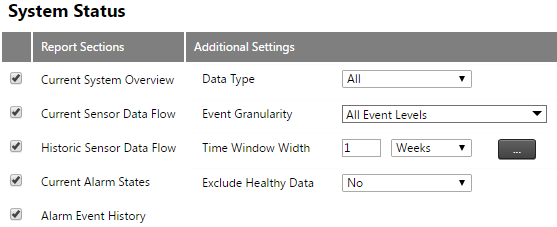
You can include different system status reporting in your system status report by selecting the appropriate setting. These system status report sections correspond to the different system status areas discussed in the System Status section.
-
Current System Overview: Shows a synopsis of the system health.
-
Current Sensor Data Flow: Shows health information about readings received for sensors.
-
Historic Sensor Data Flow: Shows health information about readings received for sensors in the past.
-
Current Alarm Status: Shows information about the alarms in your project.
-
Alarm Event History: Shows historic information about alarm events.
The Additional Settings on the right hand side are related to the particular system status report sections you select.
Available fields include:
-
Data Type: Use this field if you wish the report to only include system status information about sensors associated with a particular Data Type.
-
Time Windows Width: This setting here is similar to the Report Time Period described previously. This is the period over which the report content should span, typically the last 24 hours, or the last 7 days.
-
Exclude Health Data: Enable this option to exclude healthy data from your system status report. This is useful if you want to make unhealthy status more prominent.
-
Event Granularity: If you selected the Alarm Event History system status report section, then you can specify the Alarm Event Granularity here.
