Using the scatter plot
The Scatter plot page and the Charts page have similar controls and behavior (see Using charts). This section reviews the controls and behavior specific to scatter plots.
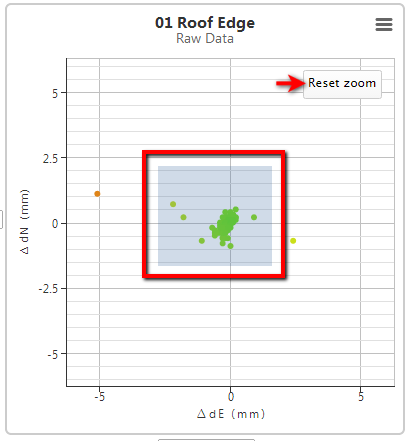
Zoom into a scatter plot area
Click on the chart and drag an area to zoom into that area. The chart may reload to zoom into the selected area.
If you have zoomed into an area a Reset zoom button is available. Click the Reset zoom button if you wish to reset the zoom level.
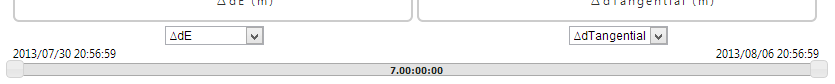
Date range
The Date Range slider is located directly below the X axis drop downs. To narrow the date range, drag one of the slider handles (initially located at the start and end of the slider). Both slider handles of the date range slider can be moved together simultaneously by dragging the area between the two ends.
The total duration between the slider handles is displayed on the slider itself.
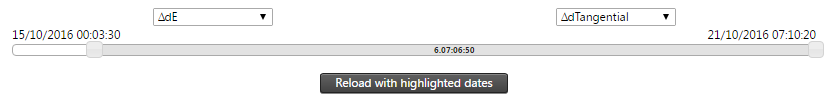
A Reload with highlighted dates button appears when the date range is narrowed. Click this button to set the start and end date and reload the scatter plot for the new date range. This may cause the scatter plot to display a more fine grained summarized data or raw data.
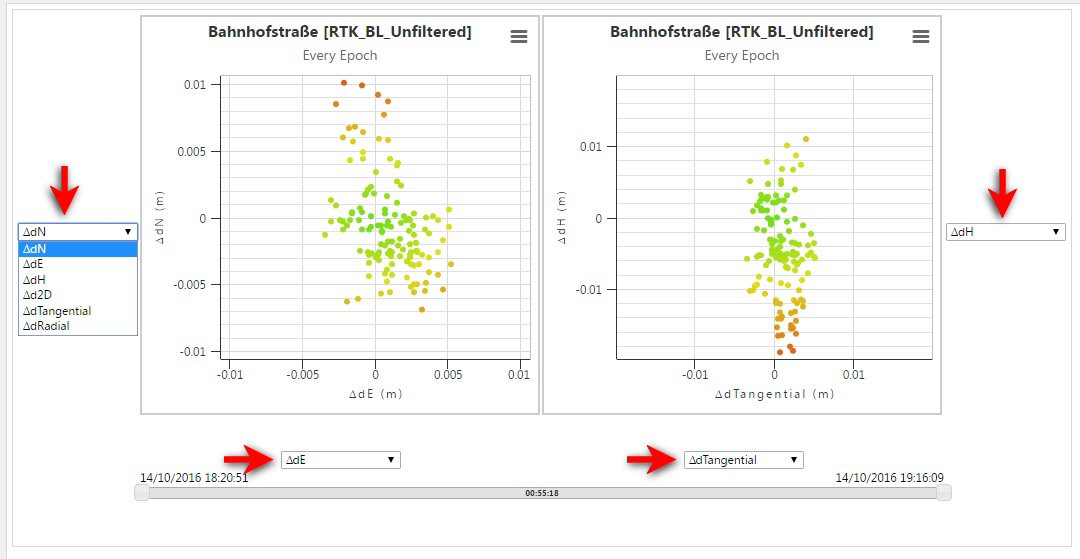
Y axis and X axis selection
Use the axes drop-down lists to select the dimensions to plot against for the X axis and Y axis.