Sensor data flow status
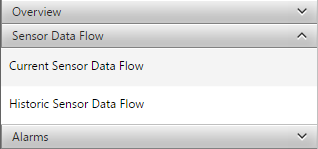
The Sensor Data Flow area is located in a tab in the System Status section.
The sensor data flow area is used to analyze the performance and age on the latest available observations for each sensor. This is useful to see that data is being delivered correctly for each sensor.
Current sensor data flow
Select the Current Sensor Data Flow option. The page shows a table. If the project has many sensors, use the filters at the top of each column to quickly view sensors of interest.
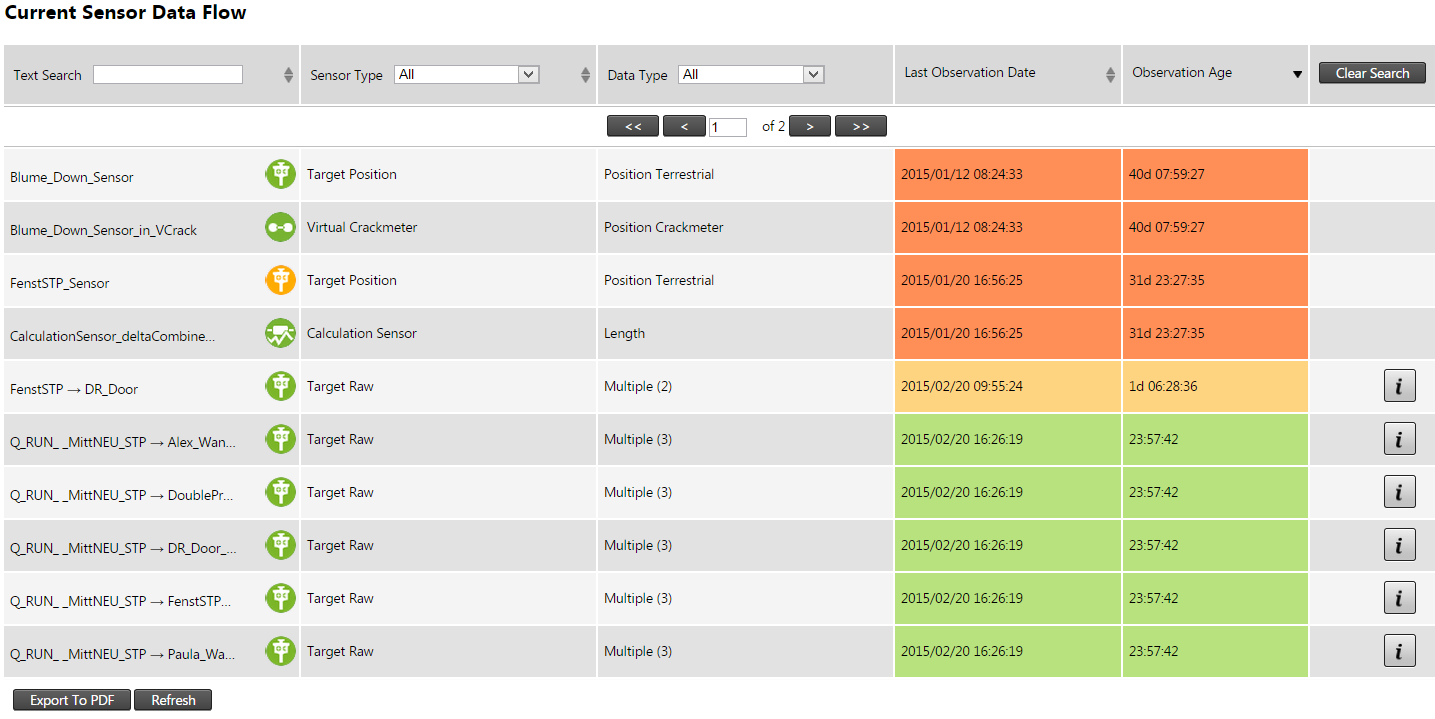
A color-code is applied to each Sensor Data Type with the following meanings:
-
Green: Data delivery appears to be healthy.
-
Orange: Data delivery appears to be delayed.
-
Red: Data delivery appears to have stopped.
Historic sensor data flow
Click the Historic Sensor Data Flow option to view the past data availability on sensors in your project.
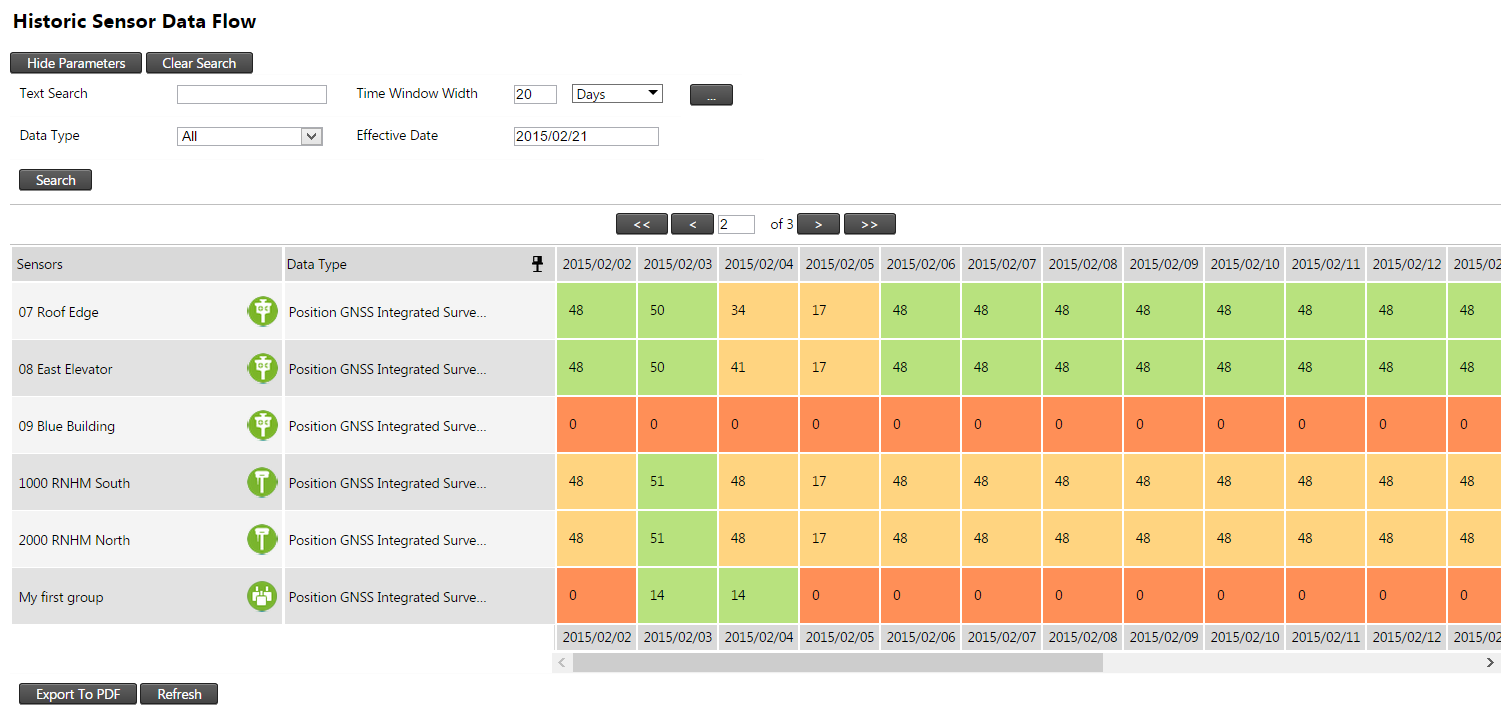
In the example above, the sensor history is displayed for the past 20 days. Each cell represents one day per sensor and the total observations that day. As can be seen, the healthy green cells have more readings than the orange cells, which again have more than the red cells provided no observations. Use the pin icon on the Data Type column heading to keep the sensor details fixed when you scroll through the columns to the right.
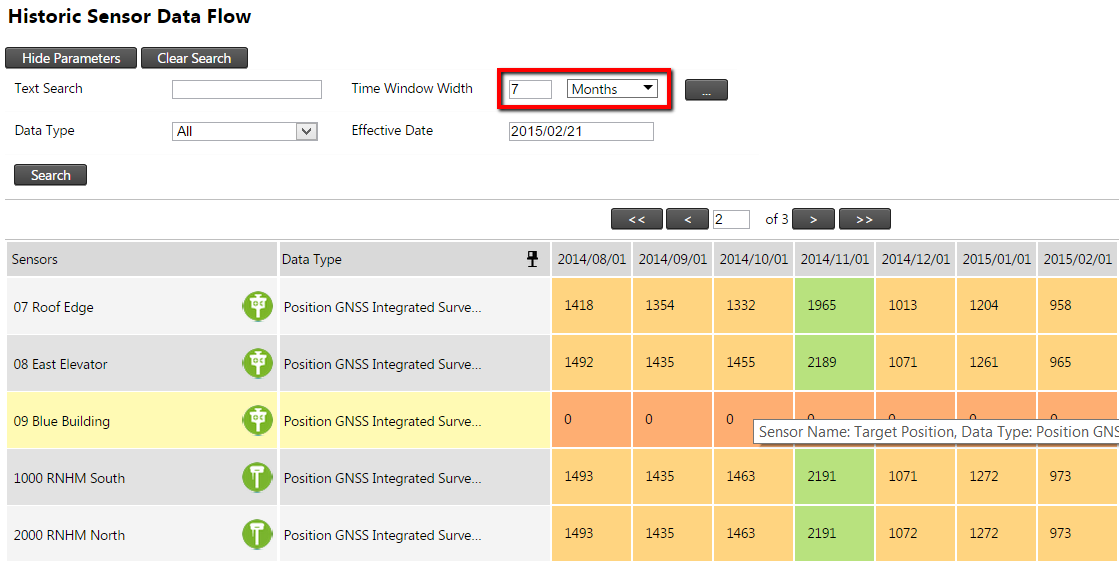
The 20 day time window can be changed. In the example above we changed it to 7 months.
