Matched data series
The Matched Data Series feature on the Normal Analysis type was requested by the mining industry. The reason for creating a Matched Data Series is to fit a regression line and analyze the behavior of a rock body over a period that is longer than the life of any particular sensor. Of course this will only make sense if the two different sensors are installed in roughly the same region.
This functionality is seen as a historical analysis and is only available in fixed date range mode. Make sure your analysis is not configured to use a rolling window date range mode.
The functionality only becomes available if you have multiple series with the same Data Type, Value Column (or component) and Reduction. Typically you need to create an analysis with multiple sensors of the same sensor type.
An example setup of a Matched Data Series is provided at the end of this topic, but first this topic describes the two matched data series cases at a conceptual level.
Sensor A existed at a location and was decommissioned before Sensor B was installed at the same location. The analyst wants to get an understanding of how the ground moved over the entire period and the period in question is longer than the lifetime of either sensor.
For setup reasons, Sensor A and Sensor B may have yielded displacement values that are not the same. For example, it may have been that both sensors started at a displacement of zero.
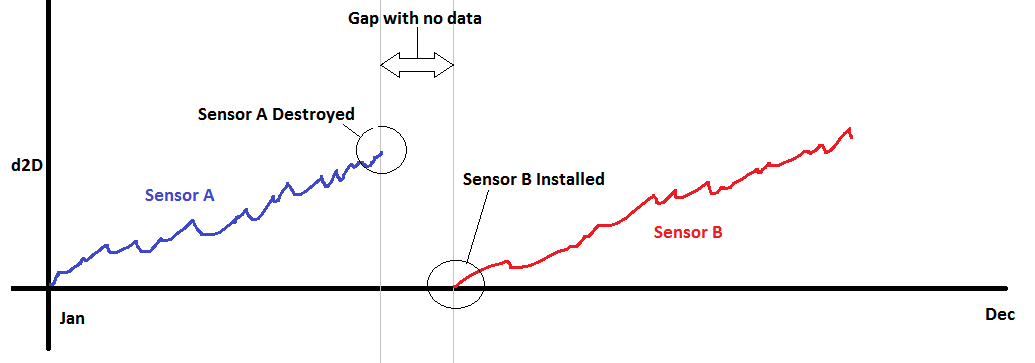
The matched data series feature should enable the analyst to create a new series by joining the series of Sensor A and Sensor B together. In doing so, one of the two series will be kept fixed (not shifted up or down) and an offset will be applied to the other series (shifted up or down). These options will be demonstrated below.
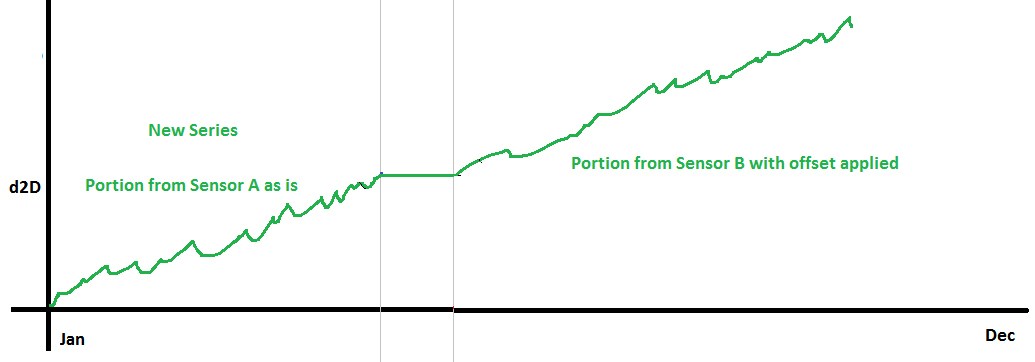
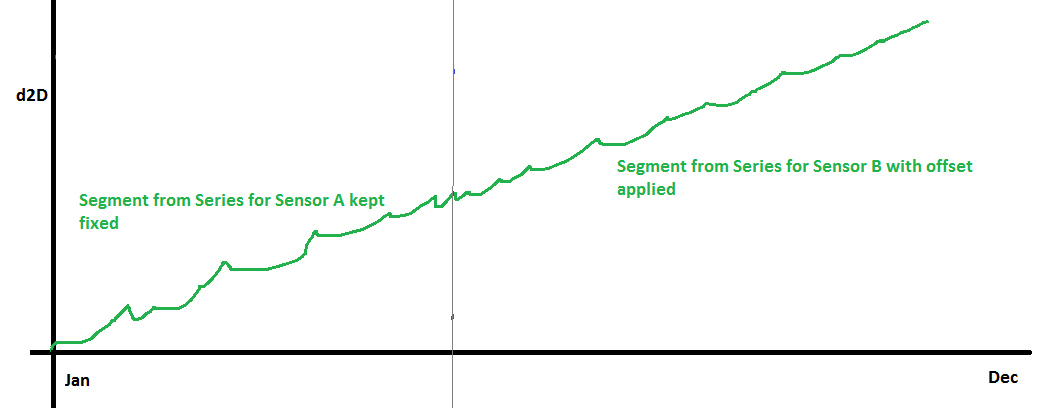
Option 1: The series of Sensor A was fixed, and the series of Sensor B was shifted up. A regression line can now be fit to the new series.
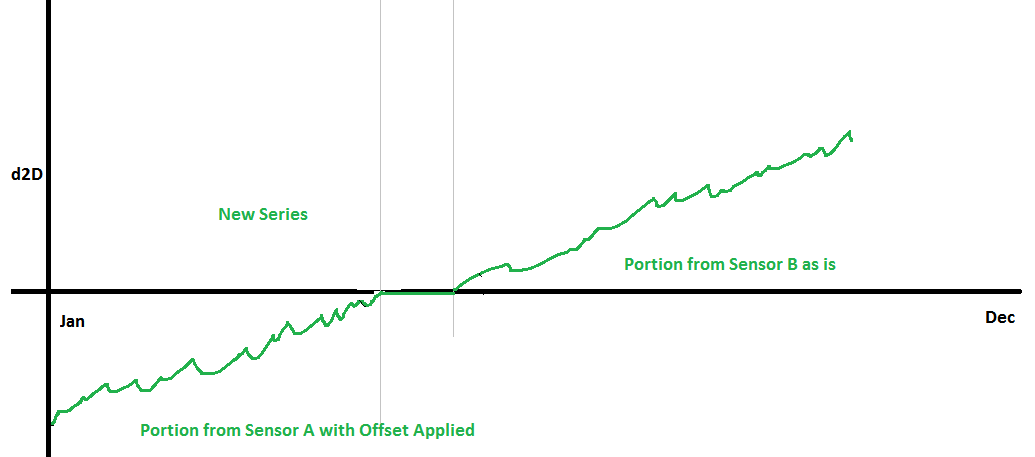
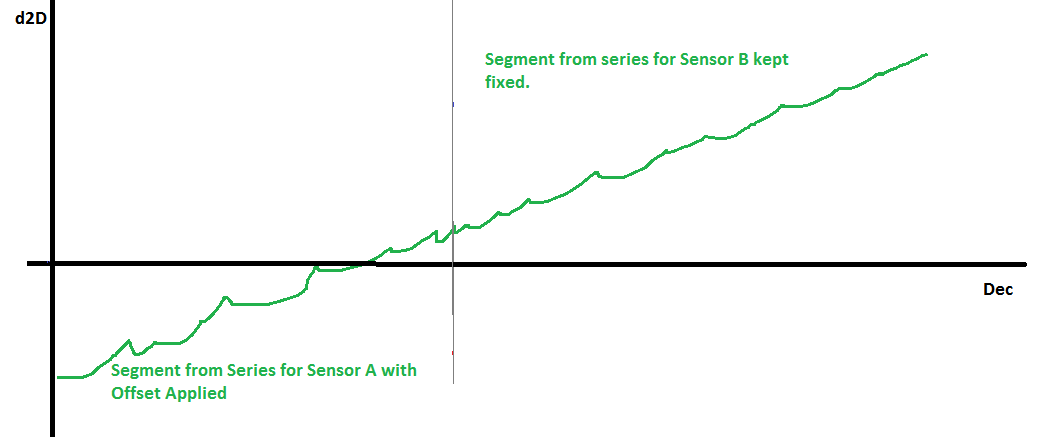
Option 2: The series of Sensor B was fixed, and the series of Sensor A was shifted down. A regression line can now be fit to the new series.
Sensor A existed at a location and a Sensor B was installed at the same location before Sensor A was decommissioned. The analyst wants to merge the series from Sensor A with Sensor B in order to fit a regression line and analyze the behavior of the rock body. To do this, the analyst needs to specify the point in time that should be used for intersection purposes.
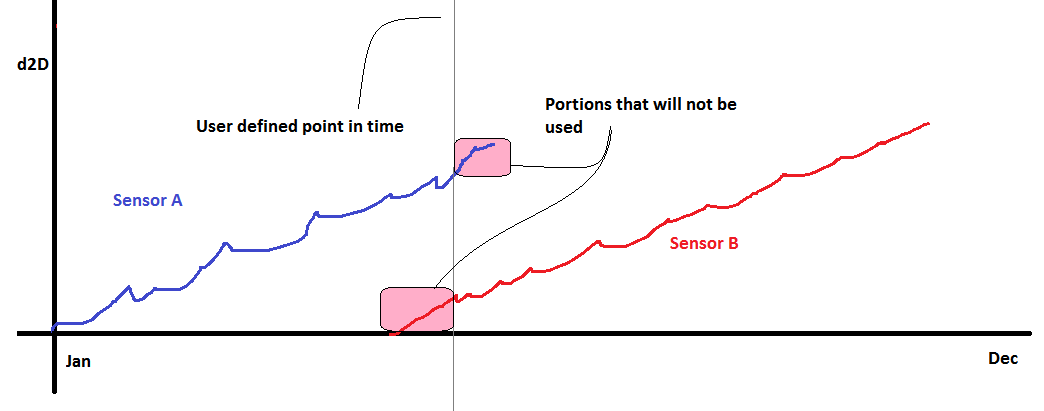
The matched data series feature should enable the analyst to create a new series by joining the series of Sensor A and Sensor B together. In doing so, one of the two series will be kept fixed (not shifted up or down) and an offset will be applied to the other series (shifted up or down).
Option 1: The series of Sensor A was fixed, and the series of Sensor B was shifted up. A regression line can now be fit to the new series.
Option 2: The series of Sensor B was fixed, and the series of Sensor A was shifted down. A regression line can now be fit to the new series.
In this section we present an exhaustive example configuration of matching three series segments. Although in this example all three sensors have data over the entire period, the configuration can be applied in a similar fashion if some sensors only have partial data.
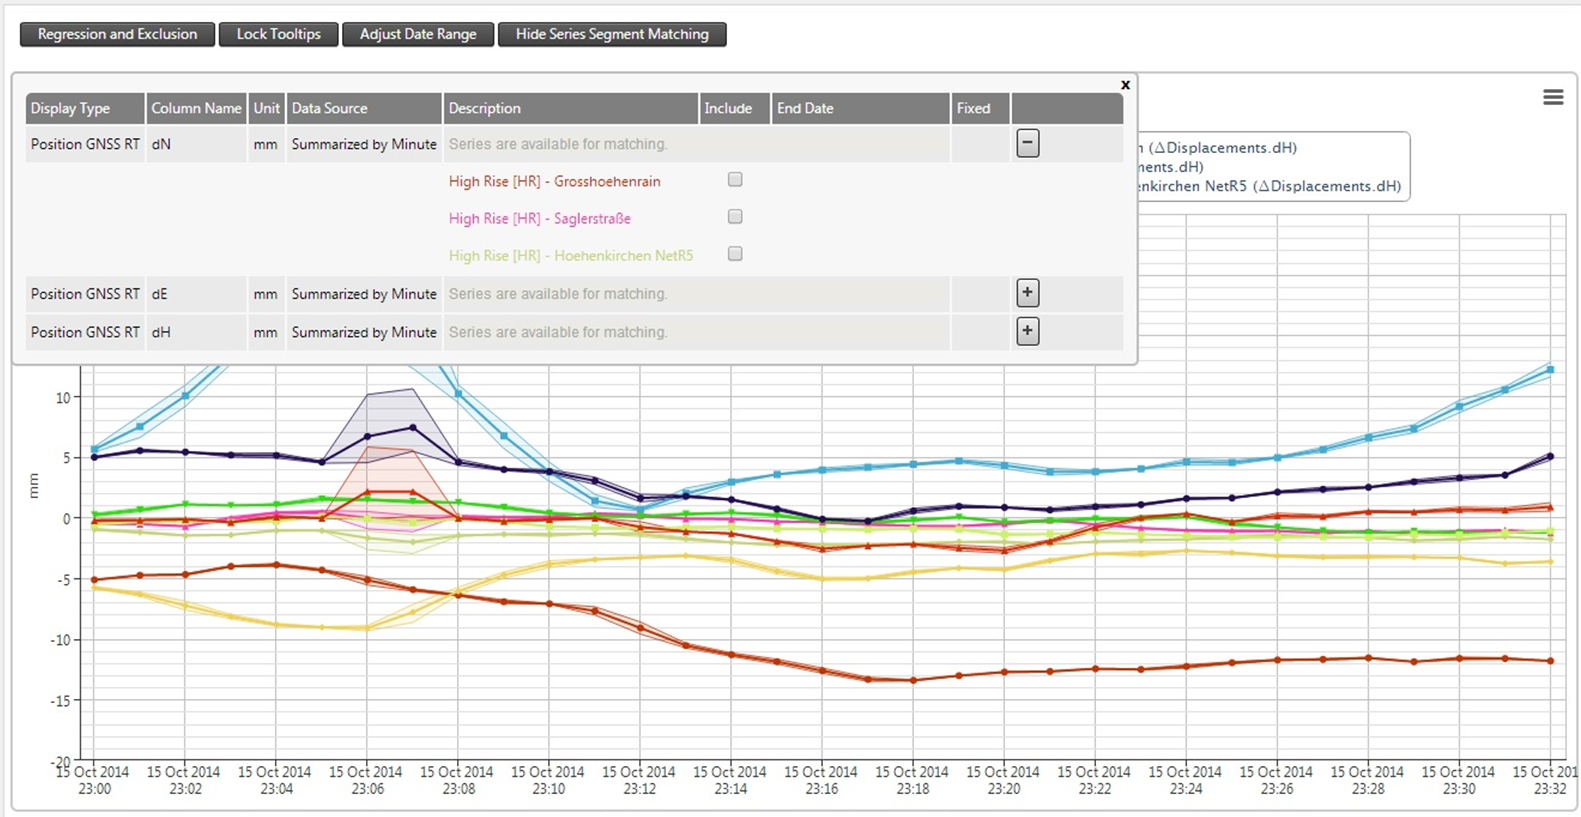
Click the Match Series Segments button to expand the configuration grid.
Note that you can click and drag the expanded grid control in order to view the analysis chart area behind it. The grid will contain expandable groups. Each group contains series that could potentially be matched together. (You cannot merge dN with dE for instance).
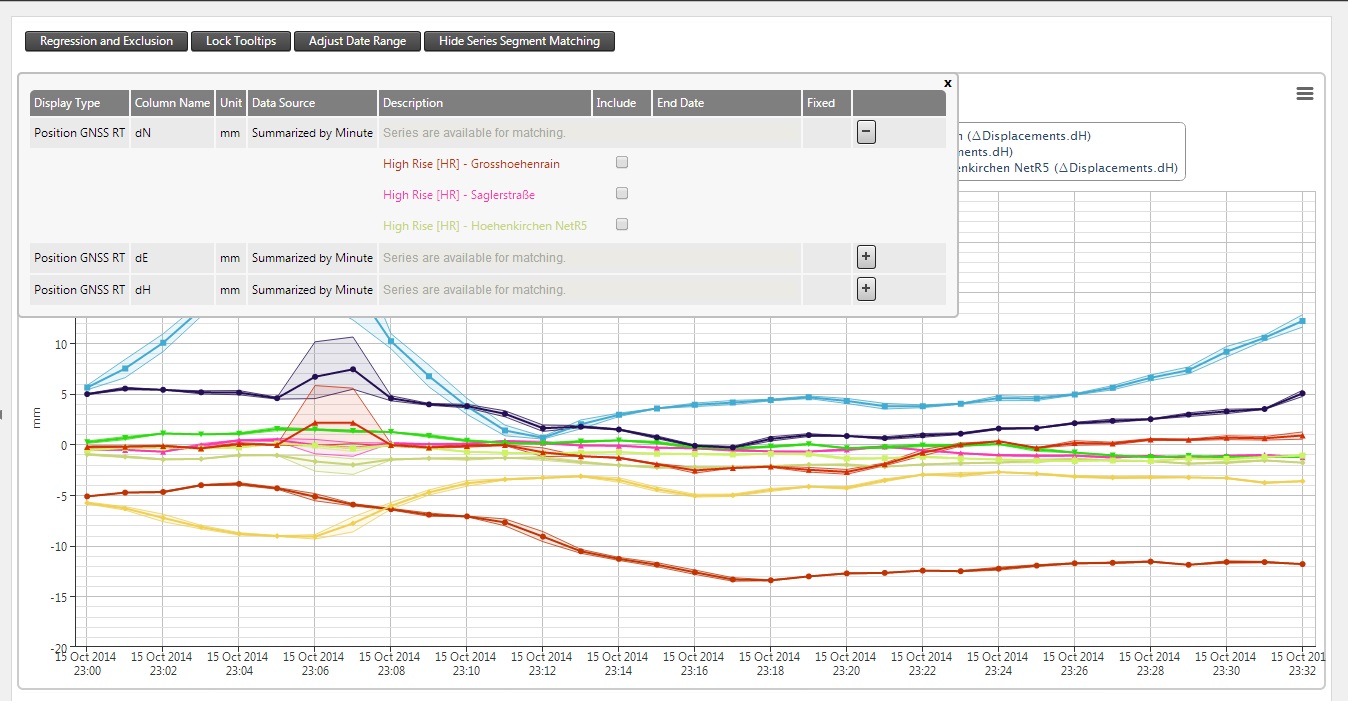
Expand the group you want to work with and pick two or more series. As soon as you pick the second series, all other series which are not candidates to be matched are temporarily hidden on the analysis chart area. You can now specify a new name for the calculated series, or use the suggested name. You can also specify a color for the new series that will be created. Use the up and down arrows to indicate the order in which segments should be taken from each series.
In our example below the order is the light blue series, purple series and red series. Indicate which one of the series should be fixed (the first segment will be fixed by default).
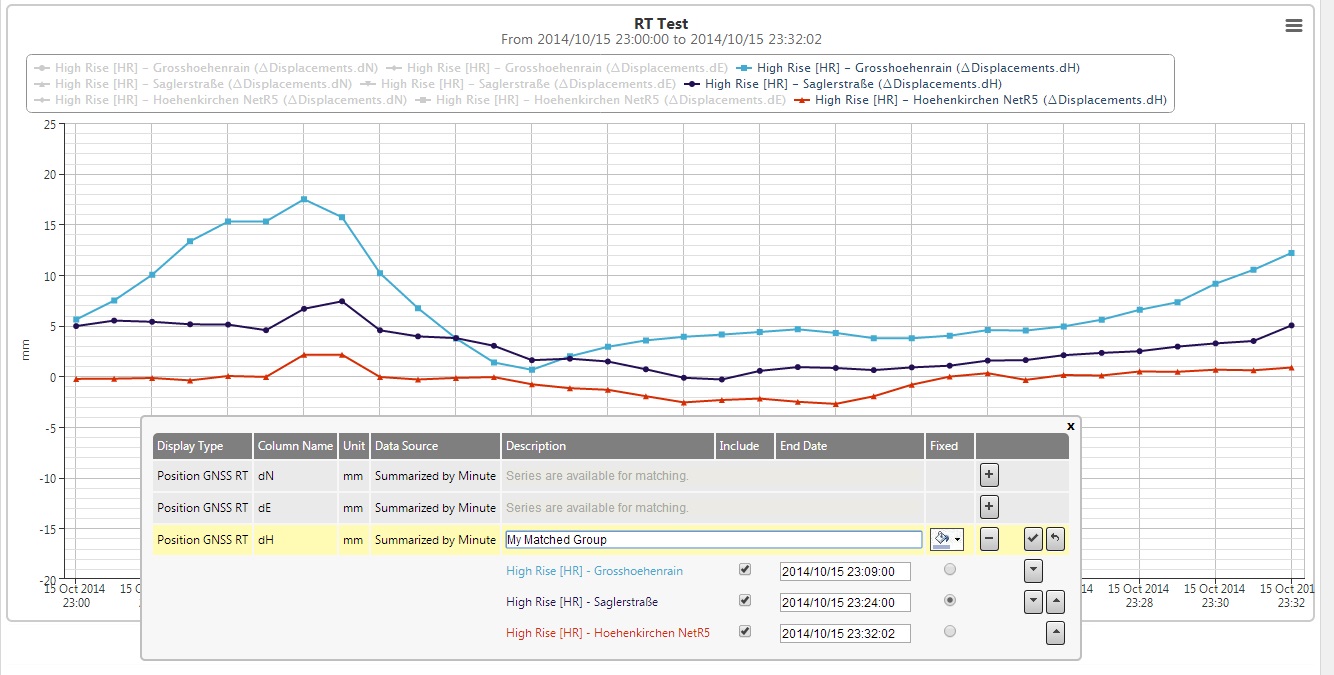
For each series, indicate the end date for the segment. This is the point up to which data will be taken from that series to create a series segment. Normally this date would be the date of the last available observation in that series. You can do this by entering the date or by clicking on a particular point on the series on the chart surface. Note that the end date for the one segment also serves as the start date for the segment taken from the next series. When you are matching more than two series segments, then you need to ensure that the end dates for each segment are in the same sequence as the series themselves.
For the series order in this example (light blue series, purple series and red series), we must ensure that the end date for the light blue series segment is before the end dates of the other series segments. We also need to ensure that the end date for the purple series is before the end date of the red series. You will be presented with a validation error message if this is not the case.
You can now click the  button to save the newly created matched series group.
The calculated series is added to the analysis:
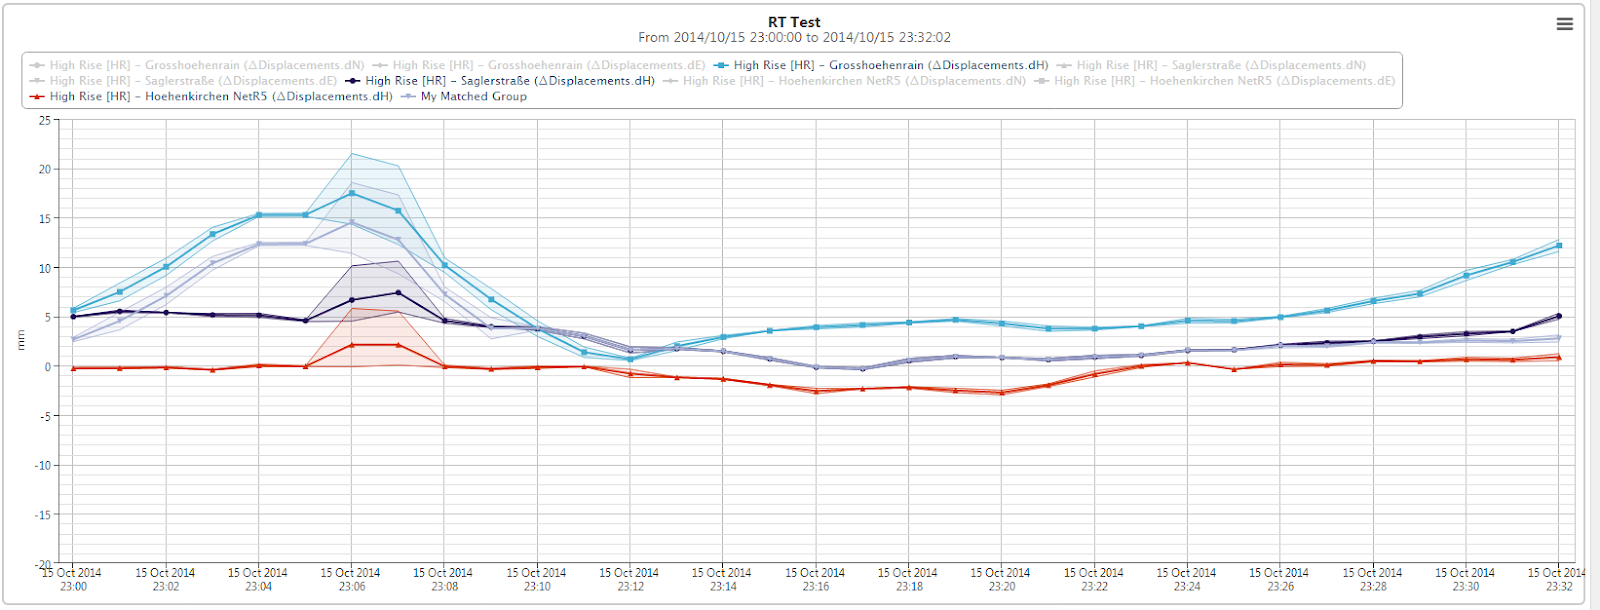
You can inspect the tooltips of the calculated series. You will note that an offset may be applicable. In our example the purple series was kept fixed and has an offset of zero. You can now fit a regression line to the calculated series, open the matched series configuration grid again to create other matched series segments (e.g. for dE or dN) or change the settings of an existing matched series.
It is important to note that if you edit the analysis and change certain aspects of either the analysis or the series (for example, Data Type, Sensor, Reduction, Value Column etc) then the matched groups may automatically be removed.