Regression and exclusions
To view regression and exclusions data for the analysis series, click the Regression and Exclusions button at the top of the Normal Chart Analysis.
-
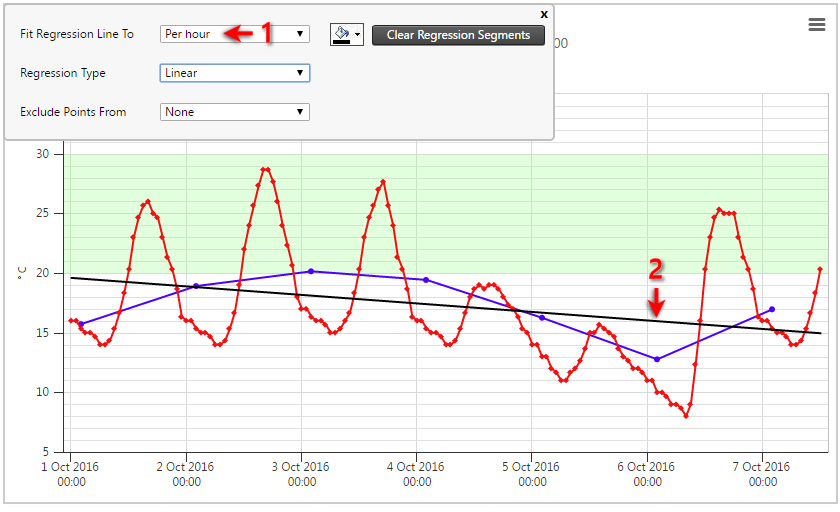
Select the analysis series to which you wish to fit the regression line.

-
The regression line will then appear on the chart. The default Regression Type is set to Linear, you can change this to various other regression types.
-
To exclude points from an Analysis Series, select the series in the Exclude Points From field.

-
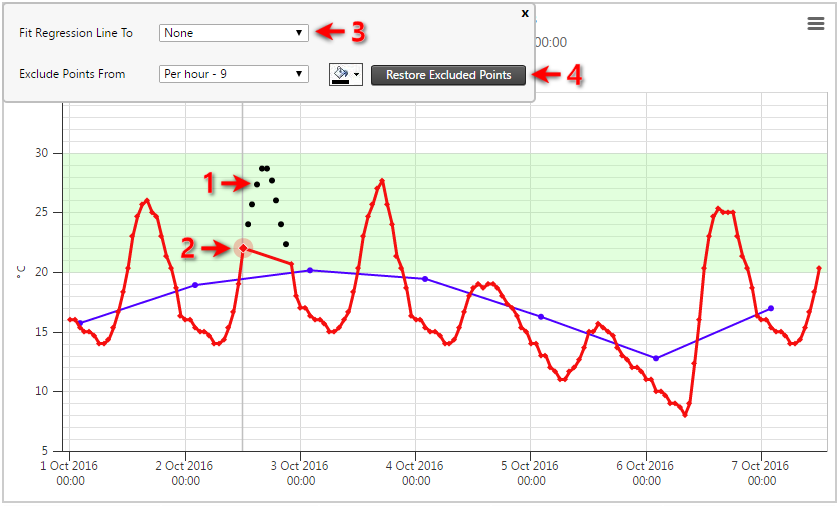
The Fit Regression Line To will automatically show no regression line. This is to avoid clutter while selecting exclusion points. Click the points you wish to exclude.
In the example above the point to exclude is shown as (2), and (1) shows we already excluded some points (shown as 2 in the example above).
The points you exclude are automatically be remembered for this analysis.
-
Once you are finished excluding points you may select Fit Regression Line To (3) to show the regression line you previously selected again.
You will notice that the excluded points are neither displayed nor used by the regression fit. Point exclusion is useful if some points on the series are outliers or incorrect measurements.
-
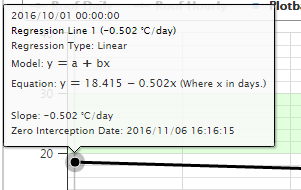
Move the mouse cursor over the regression line to see a tooltip displaying the following details:

-
Regression Equation: The equation of the regression curve on the chart area.
-
Slope: The slope of the regression line. Only applicable if the regression fit is Linear.
-
Zero Interception Date: The date at which the regression line will intercept the zero line (y=0). This is also only applicable if the regression fit is Linear.
-
-
Click the Restore Excluded Points (4) button to restore the points you excluded from a particular analysis series.