Vibration events
This section describes the Vibration Sensor Charts and the Vibration Events created by vibration sensors.
To view the Vibration Events area, select Vibration Events from the Charting and Analysis menu or from the Home page. Alternatively, it is possible to view this area through the Sensor View of a vibration sensor.
Vibration sensor charts
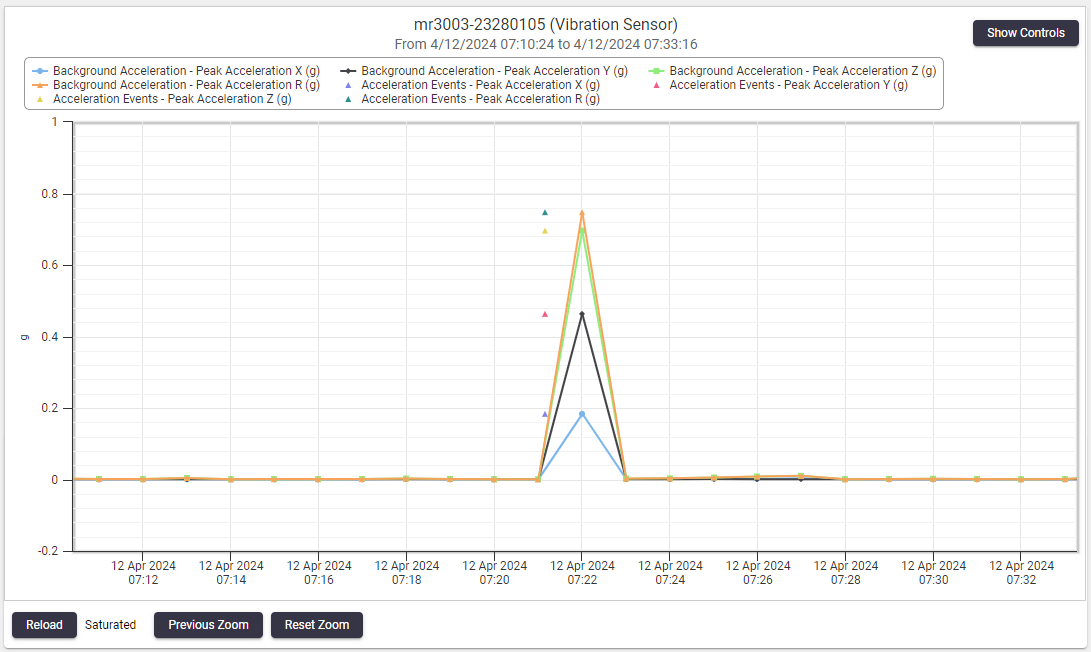
Vibration sensors measure data at high frequencies which can congest the data transfer methods and use excess database storage. Background information which does not meet the event threshold is recorded at a user defined interval, for example every 20 minutes, and is then sent to T4D with only the peak values for that period.
Vibration sensor charts include both background information, and event information. Click on a Vibration Event, symbolized by a triangle, to open the Event Waveform.
Vibration events
Event data are short recordings triggered by specified trigger thresholds on vibration sensors. Typically, their duration is no more than two minutes, but it depends on pre-event and post-event settings on the sensor. Vibration event recordings are immediately provided to T4D.
Vibration events listing
In the Vibration Events section you can search for events based on filters provided.
Changing the filters will automatically filter the Vibration Events listed below.
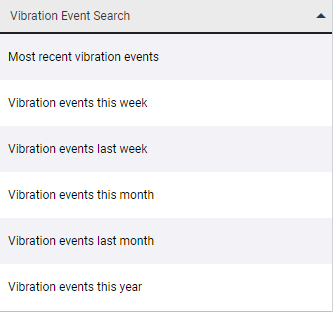
In addition, you can filter sensors based on attributes from the event:
-
From and To Date: Specify the time frame the event occurred in.
-
Text Search: Filter by the name of the sensor.
-
Event Type: Filter between Acceleration and Velocity events.
-
Peak Vibration: Filter by minimum peak vibration in any component.
-
Duration: Filter by minimum event duration.

The Vibration Events listings include a high-level view of the event:
-
Event Time: The date and time the event occurred.
-
Sensor: The associated sensor that measured the event.
-
Peak Vibration X: The peak value recorded during the event in the X direction.
-
Peak Vibration Y: The peak value recorded during the event in the Y direction.
-
Peak Vibration Z: The peak value recorded during the event in the Z direction.
-
Peak Vibration R: The peak magnitude recorded during the event.
-
Duration: The total event duration in seconds.
-
: Click
 to view the Event Waveform.
 -
: Click
 to download the raw data file containing all recorded data samples in .txt format.
Vibration Sensors measure either velocity or acceleration. The peak vibration will be either velocity or acceleration depending on the sensor type.

Event waveform
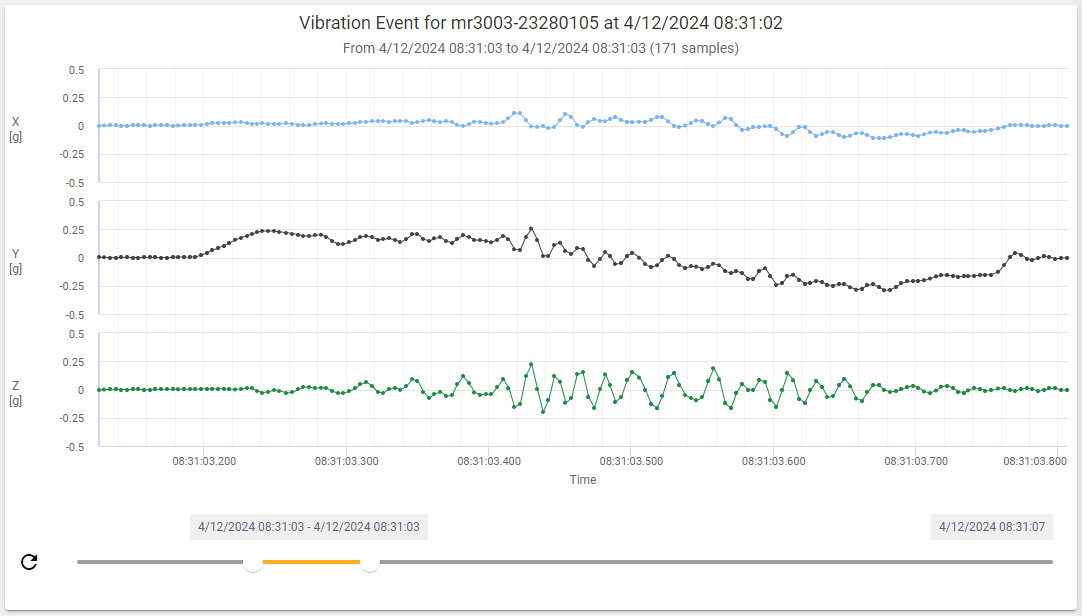
Unlike the background information, which only contains the peak values, the Event Waveform includes all sensor readings for the duration of the event.
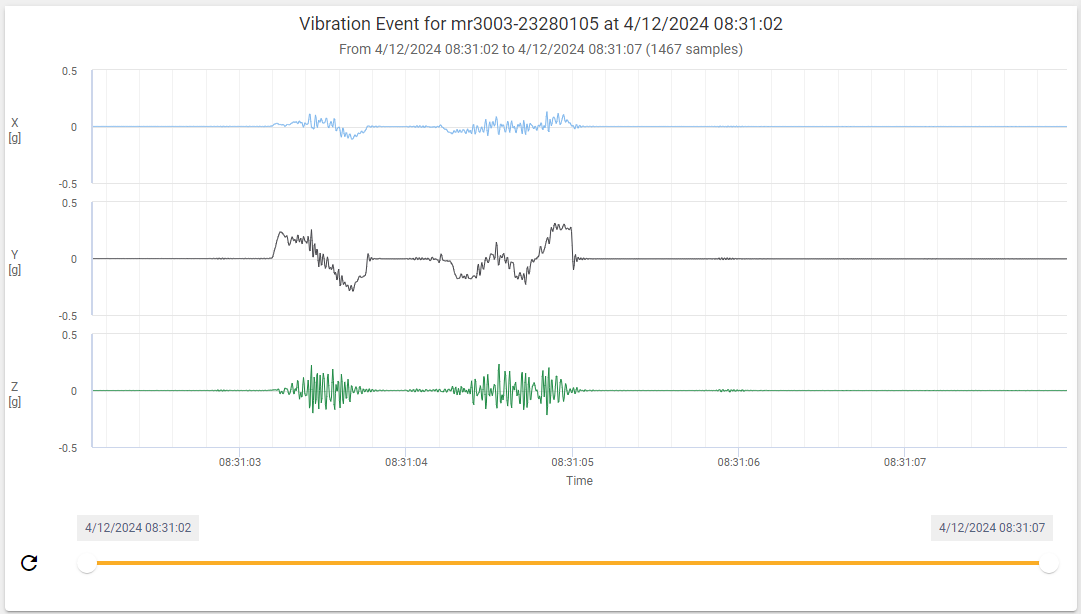
To view the individual reading components for a specific time hover your mouse over the chart. A popup appears showing the vibration value in the X, Y, and Z components.
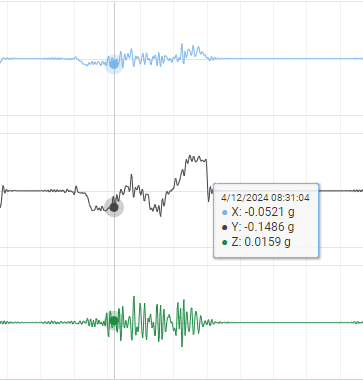
Click and hold on the graph to zoom into the waveform. The region of interest will appear blue while selecting and the graph will zoom once the mouse is released.
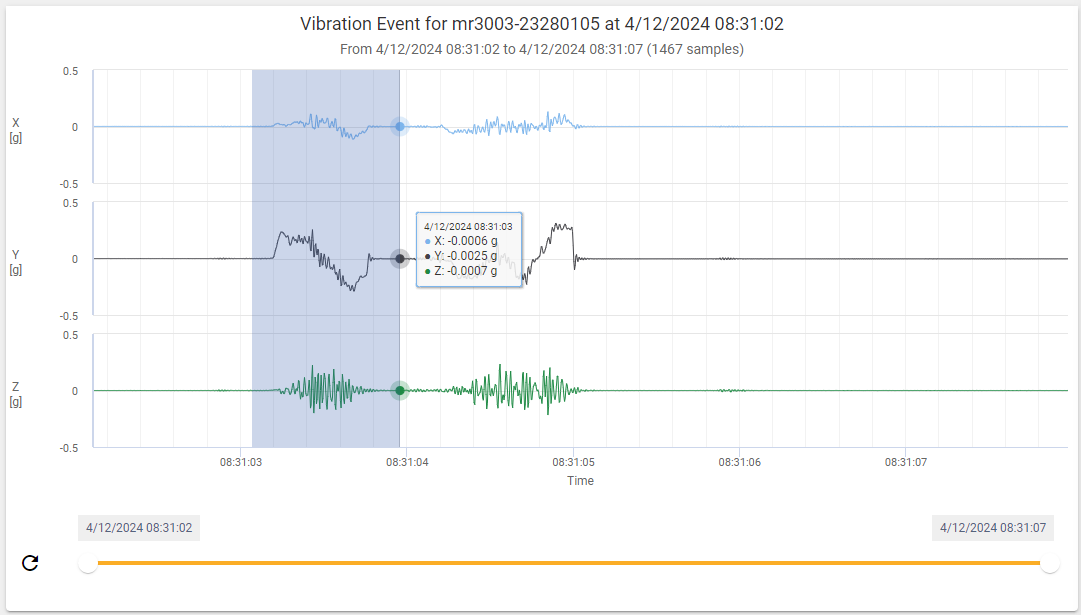
To reset the zoom level, click the refresh button at the bottom left corner.
