Review Project Status on the Dashboard
Review PPQ Metrics on the Dashboard and Map
Review Project Status on the Dashboard
After you have configured your Dashboard with widgets that give a quick look at the movement of material, work completed, and work remaining, you can begin to monitor progress, productivity, and quality (PPQ) values on both the Dashboard and Map view. Once your field crews have begun, you will receive PPQ metrics from the project site as .tag file data.
-
On the left navigation bar, click the
 Map icon (map pin).
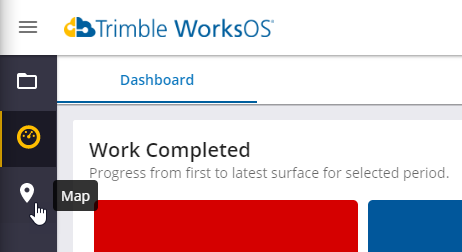
-
Explore the map filters, controls, and metrics:
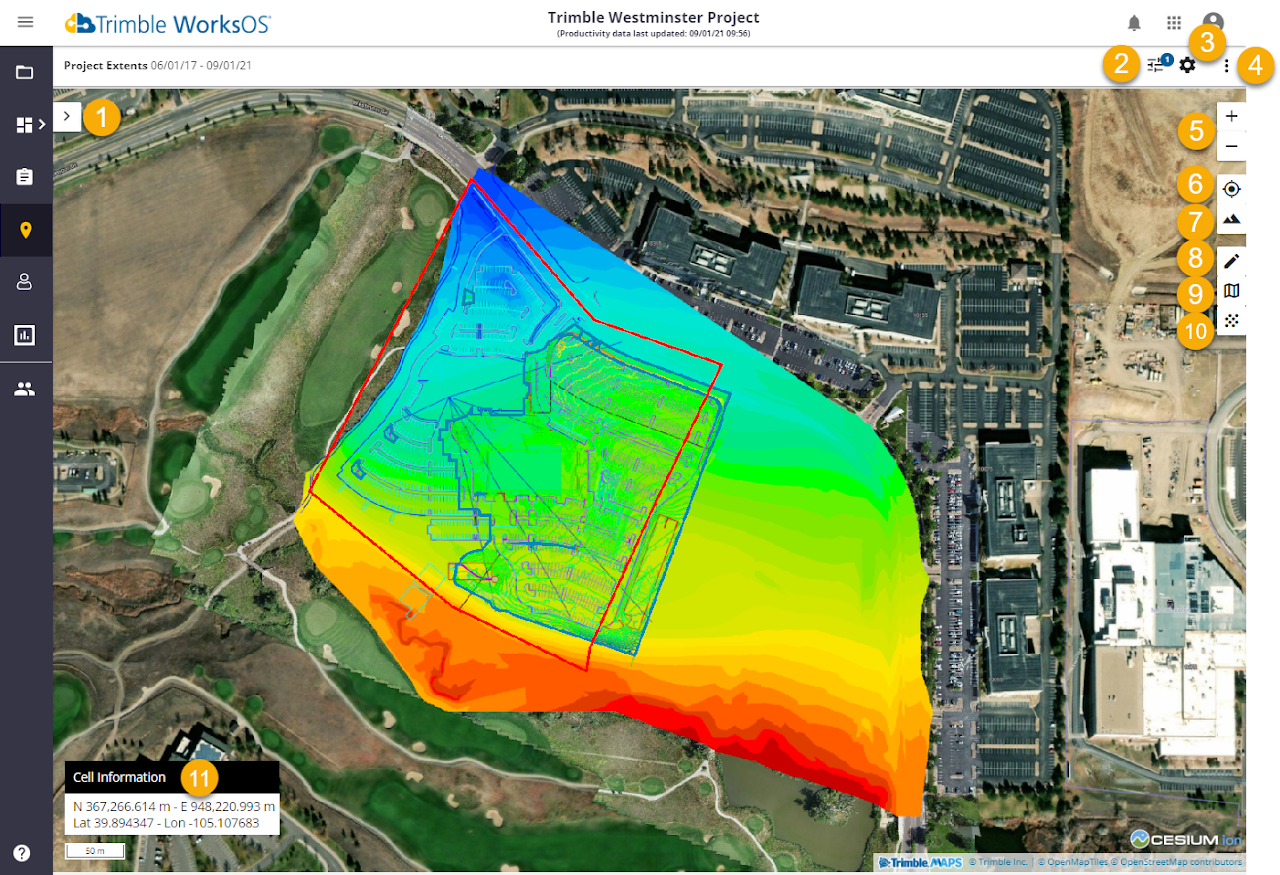
Map View Options
-
Metrics > Elevation, Volume, Pass Count, CMV, MDP, Speed, and Temperature
-
Selected Filters
-
Settings > Project Settings, Map Settings, and Excluded Elevations
-
More > Imports, Exports, and Reports
-
Zoom In/Out
-
Center (project in the view based on center of gravity within the boundary)
-
Map Type
-
Profile
-
Custom Area
-
DDV (Detailed Data View)
-
Cell information
See sections below for details on each of these.
