WorksOS Release Notes - July 2022
New & Improved
This WorksOS release includes these new features and enhancements:
Import/Export/Data Exchange
-
Import data from Trimble Connect - You can now explore a Trimble Connect project and import certain applicable file types (.dxf, .tiff, .ttm) from it for use in WorksOS. This feature works for all projects in Connect and WorksOS.
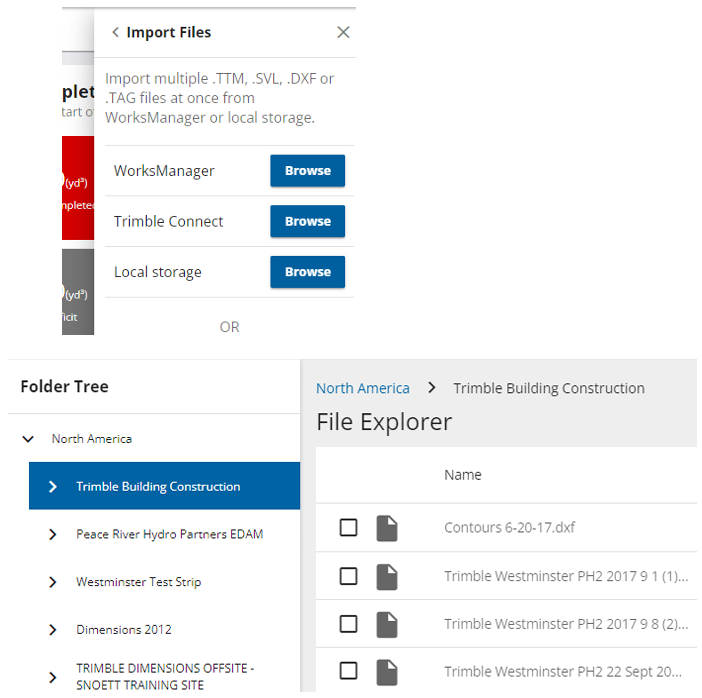
To import data from Trimble Connect:
In Trimble Connect
1. Select Data > Explorer.
2. If needed, click Add, name the new folder, and click Submit.
3. Add files to the folder, from software such as Trimble Business Center (TBC).
In WorksOS
4. Sign in and select the account and project you want to import data into.
5. At the upper right, select More icon (...) > Imports.
6. Click Import Files > Browse (next to Trimble Connect).
7. Expand your Trimble Connect region and navigate to the project folder you added f iles to.
8. Check the box next to each file you want to import, and click Import. You can multi-select files in the list or click Import All at the bottom of the Multiple File Import pane. Any files with .dxf, .tiff, or .ttm extensions are shown; previously imported files do not appear.
Note: If applicable, multiple versions (based on time/date stamp) of a file will appear too, enabling you to choose the right one. File versions are only visible when selecting a single file at a time.
9. In the import dialog, specify Units, Survey Dates/Times and/or Design file types as needed.
10. Click Import. Once imported, refresh your data views.
11. To confirm the import status at any time, click the Notifications (bell) icon in the top right corner of WorksOS.
Activities
-
See work remaining for an entire activity - By default, the Work Remaining widget on the Activity page shows the last seven days of work. Now, if you click the Work Remaining widget for an activity, you can see the work remaining for the entire activity. While in this view, you can select a different activity to see the work remaining “burndown” for it.
Map
-
Increased granularity of volume map tiles - In the last release, the Volumes Tolerance granularity was increased to 0.001 m/0.003 ft, meaning that these small changes are included in the volume calculation. This applied to the Cut, Fill and Coverage Area figures in a Volumes Calculation. Now this increased granularity to the Cut/Fill tolerances can be set in Project Settings to show these more accurate volumes consistently in the calculations AND in the Map View.
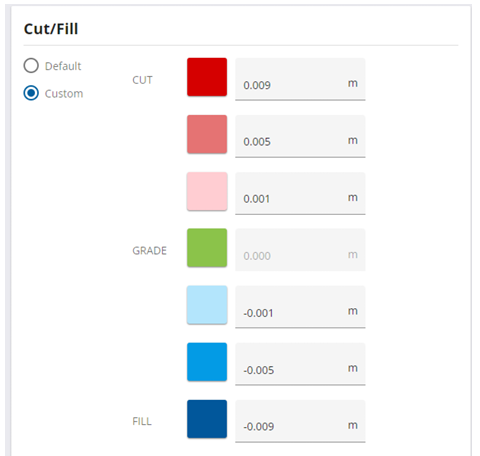
New Project Settings for Volumes Map Tile Thresholds now to 0.001m/0.003ft
NOTE: This is a display setting change only and does not impact the calculated figures of a volume, it only impacts the appearance of map tiles.NOTE: This logic only applies to data coming into the WorksOS application to that data when volumes are calculated. It is an internal logic change only and is not part of the Trimble GCS900 or Earthworks platforms.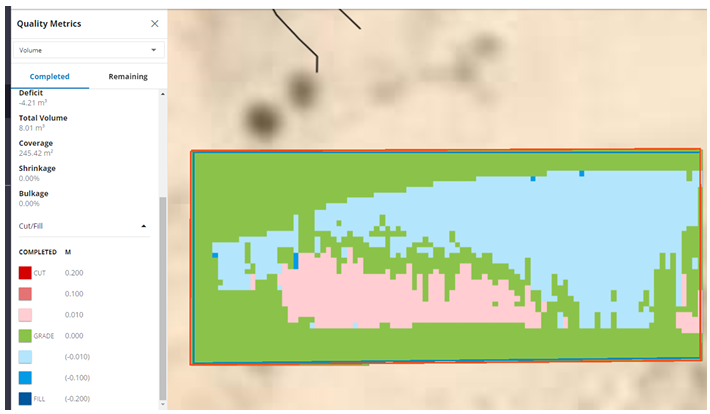
Old map tile granularity before new map tile thresholds applied
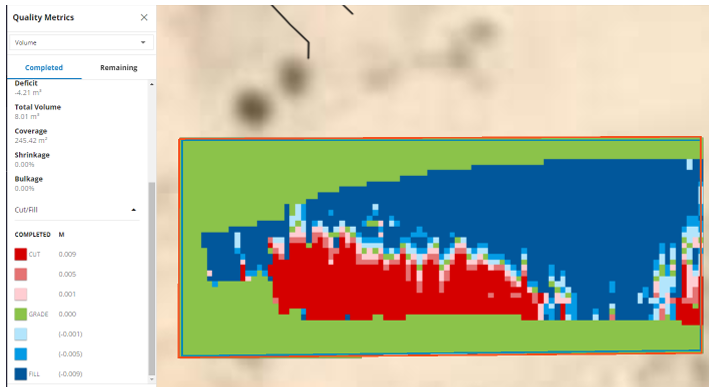
New map tile granularity after new map tile thresholds applied
Machine Data Playback
-
Play back machine data - You can now play video of where a machine (such as a compactor, dozer, or excavator running Trimble Earthworks or Groundworks) worked on site over a time period to see which of that machine’s data is valid for processing in WorksOS.
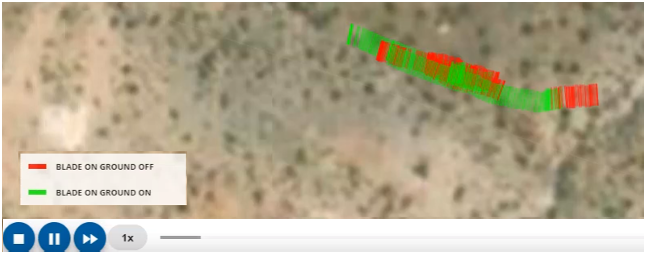
Play back a short period of automatically imported machine data (TAG files) for a single, specific machine to see where it worked and other information (such as whether the data is valid or invalid for use) about the data being consumed in WorksOS.
Data is color-coded:
-
Red - invalid; processed TAG files did not meet WorksOS requirements (e.g, the positions were bad, blade/drum/bucket was raised (blade on ground on/off))
-
Orange
-
Green - valid; processed TAG files meet WorksOS requirements
Each line in the data indicates the extents (e.g., line is drawn between the left and right ends) of the primary instrument, such as an excavator’s bucket, compactor’s drum, or dozer’s blade. These measurements are accurate to mm. The data does not indicate any part of the machine beyond the primary implement. Each line represents an epoch.
Gaps in the data might mean that:
-
A drum/blade/bucket was not being recorded because monitoring/reporting or mapping was turned off.
-
A compactor drum was ‘decoupled’ due to bouncing on rough ground.
Both valid and invalid data are shown during playback to help you understand and potentially troubleshoot data collection (e.g., blade-on-ground settings are wrong) . See the video here.
To play back machine data:
1. Open the Map View in WorksOS.
2. Identify the machine data you want to evaluate by clicking the DDV icon and reviewing the machine and date range you want to playback.
3. On the right side of the Map View, click the Machine Playback Map icon.
4. On the new Machine Playback screen, select the Machine from those that contributed data to the project, and specify the Start and End times for the playback; the default and maximum duration is a 4-hour period.
5. Click Load Data. WorksOS searches for all of the TAG files that make up the data for the specified machine and date range.
6. Once data loads (see the status message at the bottom left of the screen), confirm the device, machine name, and type in the left pane.
7. Click the Play icon at the bottom of the view. The map will zoom to the work area included in the playback.
8. During playback, watch both the graphical path of the machine in the view, and the elevation, GPS accuracy, and other properties in the left pane. The values in the left pane update throughout the playback.
9. You can change the playback speed (1, 2, 4, 8, up to 16x) by clicking the Fast Forward icon at the bottom of the screen. The playback speed is not real-time, but rather the number of epochs displayed at once. You cannot currently drag the playback head back and forth.
10. Select a different machine or time frame to play back data for those.
11. Click the Back button on the left side of the screen to return to the Map View.
Resources
-
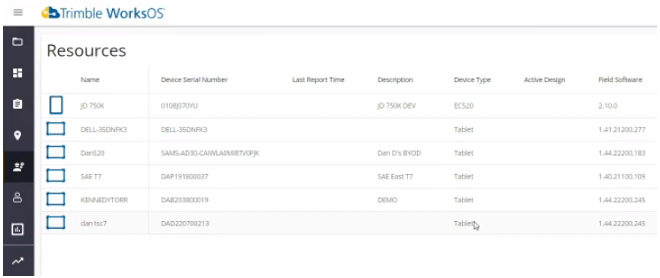
View and export a resource details list - You can now see the information last reported in from assets (machines and devices) in a project:
-
Name
-
Serial number
-
Last reporting time
-
Description
-
Active design
-
Field software
-
You can customize the Resources Table by:
-
Clicking the Table Properties icon to toggle columns on/off to show/hide them.
-
Clicking column headers to sort the rows by the column’s data type.
-
Clicking-and-dragging column headers to rearrange the column order.
-
Clicking-and-dragging column edges to resize them.
To export the table as a Microsoft Excel spreadsheet (.csv), click the Download icon.
Project Members
-
See Pending status for a project member - The Project Members page now shows which members have not accepted their invitation to the current account. Their status is shown as Pending.
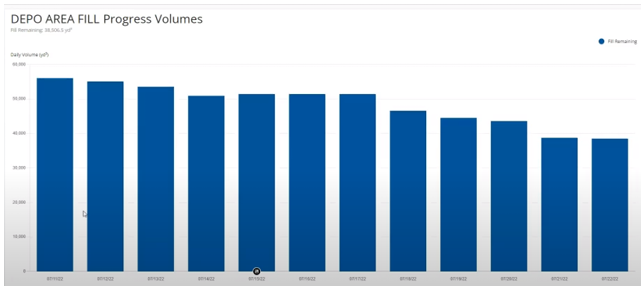
Progress Volumes
-
See progress volume details by day - Within Progress Volumes View, you can now click a bar and then View Time-related on map in the pop-up for any individual day in the chart to get a ‘snapshot’ of that day’s progress volumes in the Map View, including:
-
Total volumes
-
Total fill
-
Total cut
-
Number of machines - Click the link to open the Contributing Machines pane for the names of the machines. This can help you understand why some days are more productive than others.
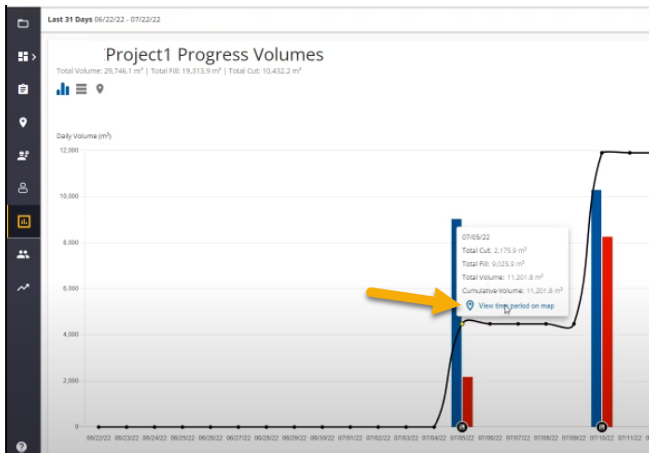
This feature lets you easily see where work in the chart was done for specific days. The Progress Volumes View is dynamic, so if you apply a filter with different days, the map will update.
-
Fixed
WorksOS also deployed fixes for reported or discovered cases in which:
-
There are no critical bug fixes to mention for this release.
