Display Refinement Report
After refining the registration of all the stations, and georeferencing your project, tap  Menu >
  Display Refinement Report to run a report.
The report is displayed automatically when a registration set (not the whole project) is refined.
The Refinement Report displays:
- In the Project Summary field:
If all stations have been successfully registered together in one registration set: The number of stations in the project, the number of registration sets (One) and the average value for RMS Error, Overlap and Consistency.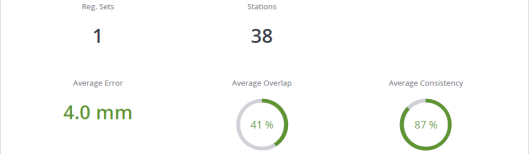
If at least one station remains un-registered: No average value for RMS Error, Overlap and Consistency is displayed.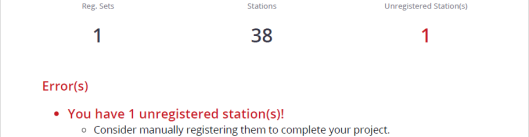
- In the Reg. Set(s) Selection Summary) field, when refining:
A registration set: The number of stations selected in the registration set, the number of registration set (One) and the average value for RMS Error, Overlap and Consistency.
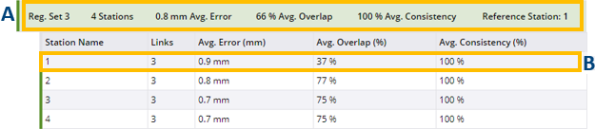
A set of registration sets: The number of stations selected in the registration sets, and the number of registration sets. - In the Refinement Summary field: the unregistered stations (if existed), the registered stations, the registration information per registration set [A], and per station [B].
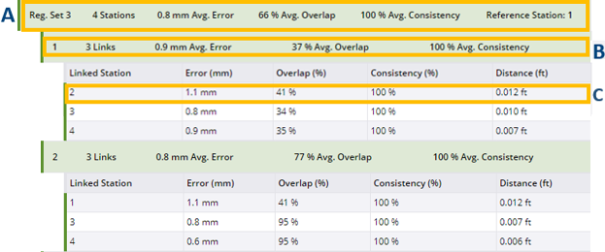
- In the Refinement Details field: the registered stations and the registration information per registration set [A], and per station (station registered to other stations [B] and station registered to one station [C].
-
In the Georeference field: the number of control points matched with annotations or precision points [A], the distance between points in a pair [B], the average distance of all matched pairs [C].
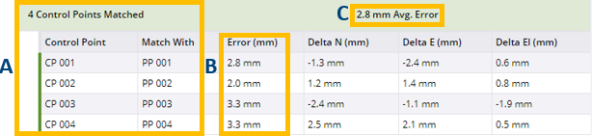
Green color means that the distance in a pair or the average distance of all pairs is under the defined Georeference Error Tolerance.
Orange color means that the distance in a pair or the average distance of pairs exceeds the defined Georeference Error Tolerance.
Change the Threshold value for the Georeference Error Tolerance. See Edit.
There is no Georeference field in the report when refining a registration set.
-
STATISTICS: Statistics consist of:
Consistency (%) giving an idea of how reliable a pair (of registered stations) is. It is expressed in percentage.
Distance referring to the distance between two registered stations (from station position to station position).
Link referring to the registration link(s) from a registered station.
Overlap (%) referring to the amount of common points per pair (of registered stations) in percentage. The percentage in a pair (of registered stations) is the same from one direction to the other (e.g. from Station_A to Station_B or from Station_B to Station_A).
Reference Station referring to a station whose position remains unchanged and the other stations will be moved to register to it.
RMS Error referring to the root mean square of the point-to-point distances on the overlapping areas. It is computed from the distances between individual points in the first scan to their corresponding scan point in the second scan. The error is symmetrical; it has the same value from Station_A to Station_B as from Station_B to Station_A.The RMS Error and Distance units can be changed in
 Settings > Units.
-
COLORS:
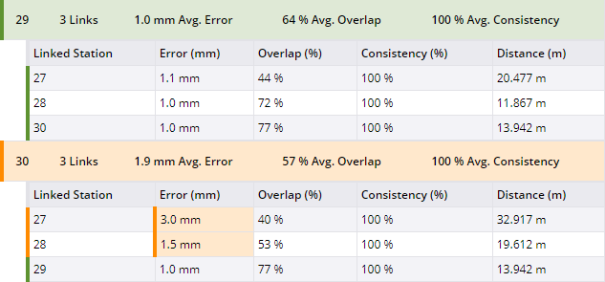
A Link displays orange in three cases:
-
If the RMS Error is larger than the defined Threshold. Change the Threshold value (see Edit).
-
If the Overlap (%) is considered poor.
-
If the Consistency (%) is considered poor. This may mean that some objects have moved or that the two scans are not supposed to match.
What does consistency mean on a link? The consistency is a ratio based on the number of points that match and the number of points that are 'obstacles', indeed like persons or objects that moved between the two scans. This is defined for a connection between two scans.
A Station displays orange if one of the links / connections from the station is orange.
What does consistency mean on a station? The application computes an average value for RMS error, overlap and consistency over all the links connecting this scan/station.
-
With the report opened, tap Edit. From the opened Edit Report Details panel, add the information about your company (Logo, Name and Website), the information about you (name and title), and additional images. If required:
- Change the Threshold value for the RMS Error. It refers to the root mean square of the point-to-point distances on the overlapping areas.
- Or reset to the RMS Error value to the default value (6 mm / 0.02 ft).
- Change the Threshold value for the Georeference Error Tolerance.
- Or reset to the Georeference Error Tolerance value to the default value (10 mm).
Tap Save.
Save the report in a PDF or HTML format file.
