Edit Color Mapping for a Surface or Difference Model
Use the Edit Color Mapping command to control the shading on a surface or cut/fill map.
|
|
|
| Sample color bands for a shaded surface | Sample color bands for a cut/fill map |
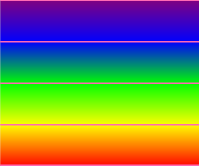
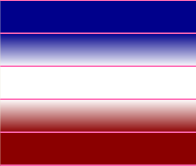
For surfaces, map colors to specific elevations. For cut/fill maps, associate colors with an at grade tolerance and cut and fill depths. Color mapping affects what appears in legends added to surfaces and maps.
You can also load color map files (.tcf) with predefined color palettes from C:\Program Files\Trimble\Trimble Business Center\Support\iv . Samples include Cut Fill Color Map, Deep Sea to Snow Cap Elevation Map, Quantm Elevation Map, Takeoff Cut Fill Map, and Takeoff Elevation Map. Then you can create a cut/fill map in colors from the selected color map file.
Prerequisites:
- Surface or cut/fill map (must be selected first)
- License; See the Subscription Plans page. For a license matrix by command, see the License page in the TBC Community. Also see View and manage licensed features.
To access the command:
Select a surface or cut/fill map in the Project Explorer, Selection Explorer, or a graphic view and:
- Right-click and select Edit Color Mapping from the context menu.
- Select Edit Color Mapping in Surfaces > Edit.
To edit color mapping:
- To open a color mapping previously saved as an external .xml file, click Load. Otherwise, edit the current mapping for a selected surface or map.
- Hover your cursor over the Preview Bar's color bands to activate the pop-up editing box. For a surface, each line in the Preview Bar indicates the elevation at which there is a color transition. For a cut/fill map, each line indicates the depths defined for at grade, cut, or fill.
- Move the cursor up and down over each line in the Preview Bar and review the elevations/depths and colors in the editing box. The color shown in the editing box indicates the color of the band above the line.
- Add, remove, and evenly distribute color bands in the spectrum as needed:
- To add new lines into the Preview Bar, click Insert and specify an elevation for the new line.
Tip: You can also simply click a position on the Preview Bar to insert a new line.
- To remove an existing line, click Delete in the editing box when hovering over a line.
- To add new lines into the Preview Bar, click Insert and specify an elevation for the new line.
- To evenly distribute the color bands, click Space Evenly.
- Set the elevation of the lowest line (bottom of the first color band) in the Origin box.
- Specify the elevation range of each band in the Distance box or specify how many color bands you want in the Count box. If you use the Distance option, check the Keep defined colors box to retain the color range shown on the previous screen.
- To reset the color bands so you can start over, click Use Default.
- Edit the color bands by selecting new colors and changing the elevations for the existing lines. Press [Tab] to enter changes.
- To save the current color mapping as an external file that you can load and use for other surfaces or maps, click Save.
- Click OK.
Options:
- Preview Bar
- Actual elevations/depths - Select this to distribute the elevation lines to their actual positions on the spectrum based on their elevations.
- Evenly-spaced - Select this to visually distribute the lines so you can better access them. This does not affect the elevations of the lines like the Even Spacing button does.
- Colors
- Smooth transition - Check this box to switch from a banded spectrum to a gradient spectrum for shaded surfaces.
- Use Default - Click this to reset the original spectrum so you can start over.
- Elevations
- Insert - Click this to add a new elevation or depth band.
- Space evenly - Click this to evenly distribute the elevation lines at specified increments.
- Delete - Click this in the editing box to remove the elevation line you are currently hovering over.
- File
- Save - Click this to store the current color mapping as an external file (.xml) that you can load to use for other surfaces.
- Load - Click this to open an existing mapping file that you previously saved.
