Add a Legend to a Surface or Map
Use the Add Surface Legend command to add a color key to any surface or map, such as a cut/fill map.
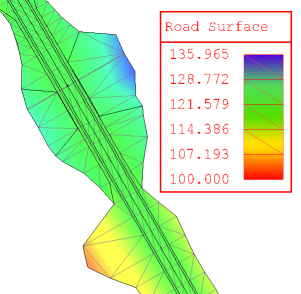
Legends help you understand:
- what elevation each color on a shaded surface denotes
- what depths the colors on a cut/fill map denote
Note: It is important to understand that legends only appear when a surface's Shading property is set to Elevation in the Properties pane.
Note: The legend displays pure colors. The surface displays using reflected light, which by definition blurs and changes the intensity (making it lighter or darker). If you rotate the surface to the correct angle it will closely match the legend.
Tip: In the Properties pane, you can also convert a legend to a table showing the area for each surface elevation band represented in the legend. Set Display areas to Yes.
Prerequisites:
- License; See the Subscription Plans page. For a license matrix by command, see the License page in the TBC Community. Also see View and manage licensed features.
- surface or cut/fill map
To access the command:
- Select Add Legend in Surfaces > Edit.
- Right-click a cut/fill map, and select Add Legend from the context menu.
Options:
- Title - Type a single line of text for the legend's titlebar or click the Browse button to open the Text Editor where you can add multiple rows of text. Type any number of characters for the first line. Press [Shift] + [Enter] to move to the next line of text (pressing [Enter] accepts the text and closes the dialog).
Note: The width of the legend is determined by the length of the title and the size of the text specified in the selected text style at the current plot scale. To make it narrower, break the title into multiple lines of text (see Title above) or change the height of the text style. After the legend has been created changing the plot scale does not affect the size of the legend or text, in ground units. To change the plot scale, select Project Settings in the Quick Access Toolbar. The click View and Plan View in the dialog's left pane.
- Surface or cut/fill map - Select the object with which you want to associate the legend.
- Location point - Pick a point in the Plan View for the lower, left corner (insertion point) of the legend's border. Once the legend is created, it can also be repositioned using the Move command.
Note: The size of the legend is controlled by the program's plot scale. To change the plot scale, select Project Settings in the Quick Access Toolbar. Then click View and Plan View in the dialog's left pane. Similarly, the precision settings used for elevations are derived from your Project Settings. Click Units and then Coordinate in the dialog's left pane.
To display a legend with a surface or map:
- Right-click the surface and select Properties from the context menu.
- In the Display in Plan View section, set Shading to Elevation.
Note: You can add a legend to a surface without elevation shading, but the legend will not appear in the view until you show elevation shading.
