Understanding Model Space, Paper Space, Sheets, and Plotting
The collection of drafting commands in Trimble Business Center gives you the power to assemble and manage an entire set of construction plans or maps with various drawing elements, such as a border and title block, dynaviews (of plan or cross-section drawings), north arrows, titles, labels, sheet numbers, etc. Understanding the concepts below will help you create individual drawings and assemble the drawings into a coherent and organized set of plans that are ready for printing.
Tip: The best way to learn about using sheets and sheet views is to import one of the sample drafting templates that is provided in the Drafting Templates command. Using a sample template as a guide, you can make adjustments to learn what style fits your needs.
Model Space and Paper Space
- 'Model space' is the 3-dimensional virtual space (defined by a Cartesian coordinate system) in which you create (or import) representations of objects to create a model. Model space is a 1:1 scale representation of the real world; it uses X and Y units (feet and meters) which you can see on the Status Bar or in the Coordinates scroll. Most of the views in the program depict different perspectives of model space: Plan View, 3D View, Cross-section View, Profile View, 3D Drive View, Surface Slicer View, and Walk-Through.
To prepare 2D representations of model space for printing or plotting, you work in paper space.
- 'Paper space' is a 2D representation of model space that you generate for the purpose of printing or plotting. In paper space, the 1:1 scale represents the scale at which the objects will be printed, not their real world-scale. Paper space uses sheet-based X and Y units (inches or millimeters which you can see on the Status Bar or in the Coordinates scroll) at a scale relative to the real-world scale used in model space. You can create objects in paper space that you only want to print, such as title blocks, north arrows, grids, and labels. Once you have prepared your model, you can view it in a couple of paper space views: Sheet Views (for plan sets, sheet sets, and sheets) and in the Sheet Set Editor.
Scaling
In some commands, you will need to specify the paper space scale at which you want to print a sheet. Typically, this is 100 feet/inch or 1 m/mm. By default, the plot scale is defined in Project Settings > View > Plan View.
- Ground (model space) – The distance measurement units used in the project model (feet or meters), which can optionally be employed in specifying the height of a text object, as opposed to specifying a drawing scale dependent text height in sheet units.
- Sheet (paper space) - The units used when the data in a project is plotted (inches or millimeters). Sheet units are calculated by dividing the ground units by the plot scale (ground units measurement / plot scale = sheet units measurement). Sheet units are used to adjust text and other graphic so they plot more legibly. Sheet units are also known as 'paper units'.
- Plot scale- The factor used to convert from ground units to sheet units (ground units / plot scale = sheet units).
For sheet scaling (paper space), the Sheet View, sheet set, and plan set are all scaled 1 : 1.
- If you draw a rectangle 17" x 11" in a Sheet View, it will print 17" x 11".
- If you have a rectangle 34" x 22" and you print it 2:1, it will print 17 x 11".
For scaling in a dynaview, there is a relationship between the real world and paper.
- So for 20 scale, 20’ in the real world would equal 1" on paper.
- 50 scale would be 50’ = 1".
Dynaviews
One way to present a portion of your model in a Sheet View is to display it in a 'dynaview'. A dynaview (dynamic view) is a portal (also known as a 'viewport') that exists in paper space, but shows whatever objects are within a frame in your model. A typical application is to create one or more dynaview frames around sections of a Plan View. Then you can place these dynaviews on a Sheet View to make a combined cross-section and plan sheet. Another use is to place a dynaview frame around a portion of a Sheet View to make an enlarged view of the model shown there for greater detail.
The advantage of using dynaviews is that they provide a dynamic view of the model (not a copy), saving memory and preventing transposition errors. When you move or change the size or shape of a dynaview's frame, the contents of the dynaview changes in response. When the model is revised, the images on the sheets within dynaviews that 'watch' that data are updated when you run the Refresh All command.
You can create a different dynaview for each sheet, assign a different plot scale to each dynaview, create several dynaviews for a single sheet, or place a single dynaview on several sheets. Dynaviews also enable you to view each plot sheet before you actually plot it. Multiple dynaviews can use the same frame. Each dynaview has its own view filter.
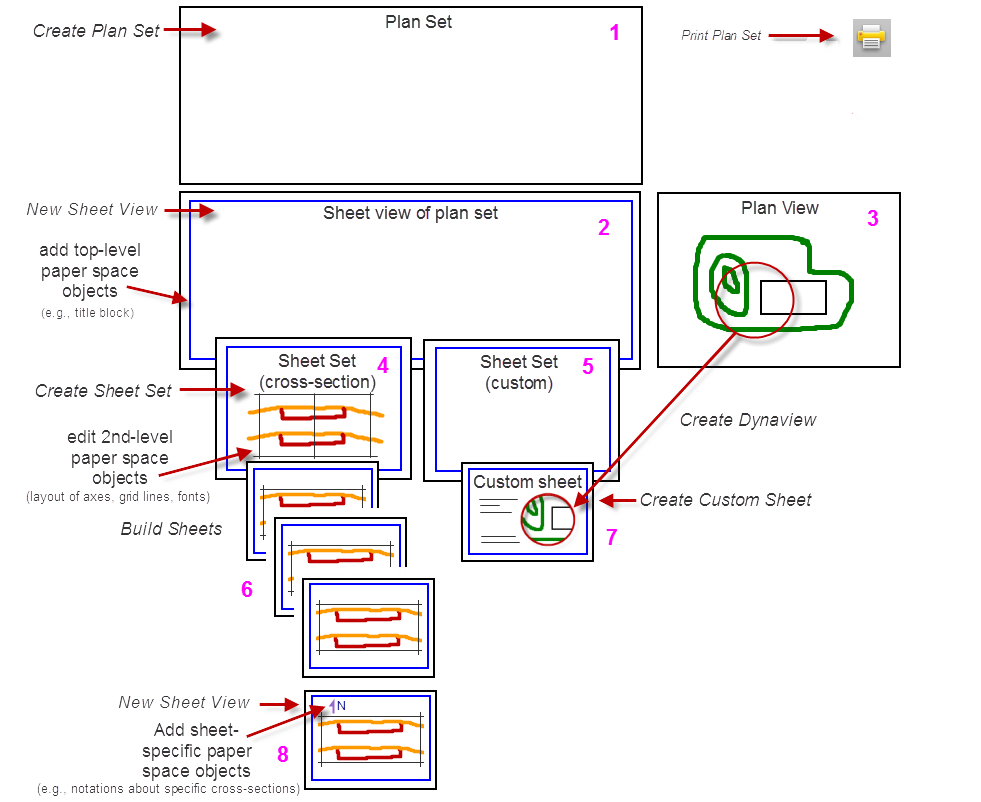
Figure: Parts of sheet plotting
- Plan set
- Sheet view of plan set
- Plan View
- Sheet set (cross-section)
- Sheet set (custom)
- Cross-section sheets
- Custom sheet
- Sheet view of a specific sheet (either cross-section or custom)
Sheet Containers, Levels, and Inheritance
In preparing your sheets for plotting, you create a series/collection of nested 'parent and child' sheets.
- Plan Set - This is the top-level collection for the entire set of plans. The plan set is a container for one or more sheet sets and all the sheets that each set contains. Any objects (such as a border) drawn at this level will be shown on every child sheet set and sheet in your plans.
- Sheet Set (cross-section) - This is a second-level collection that establishes the size of the sheets and contains objects (such as a border and title block) that you want to appear on every sheet in a common set of sheets. A sheet set is a series of sheets that are associated with each other, generally because they are of a particular type. You can configure the plan set using one or more sheet sets. In the sheet set, you can specify the sheets' axes, grids, text and line styles, labels, and more, as well as which surfaces, subgrades, and strata are displayed.
- Sheet (cross-section) - These are one or more automatically generated sheets from a Cross-section sheet set. You can add unique elements to any sheet (objects that you want to appear only on that specific sheet). Sheets illustrating cross-sections taken along an alignment can be created. These will include the cross-sections of multiple designated surfaces, and the cross-section grid and labeling.
- Sheet (cross-section) - These are one or more automatically generated sheets from a Cross-section sheet set. You can add unique elements to any sheet (objects that you want to appear only on that specific sheet). Sheets illustrating cross-sections taken along an alignment can be created. These will include the cross-sections of multiple designated surfaces, and the cross-section grid and labeling.
- Sheet Set (custom) - This is another type of second-level collection that contains a set of custom sheets (e.g., for plotting a title page or Plan View data via dynaviews).
- Sheet (custom) - These are manually-created unique sheets, such as a title page or a sheet with objects from other views presented in one or more dynaviews. Alignment-Based Plan Sheets This type of drawing is typical of that used for a simple pipeline project for which a profile view is neither warranted nor desired. It simply presents a plan view of the alignment corridor. In many cases, the geometry of the alignment and the corridor width is such that two strips of plan views can easily be placed on one sheet. You may, therefore, create either single or double plan sheets as your needs may warrant.
- Sheet Set (cross-section) - This is a second-level collection that establishes the size of the sheets and contains objects (such as a border and title block) that you want to appear on every sheet in a common set of sheets. A sheet set is a series of sheets that are associated with each other, generally because they are of a particular type. You can configure the plan set using one or more sheet sets. In the sheet set, you can specify the sheets' axes, grids, text and line styles, labels, and more, as well as which surfaces, subgrades, and strata are displayed.
Although Trimble Business Center creates the drawings for you, you have control over their content and format. Sheets are created in Sheet View and arranged in the order in which they will appear in the final plan set. You can create new sheets and place them at any desired position, delete existing sheets, or change the order of sheets within the plan set.
Templates and Customization
You can import from a variety of pre-defined drafting templates that include a plan set and one or more sheet sets using the Drafting Templates command. Then edit any of the objects and settings from the template to meet the needs of your project data. All of these settings can then be saved in a project template and optionally exported as a Project Link file (.vcl). You can work with one drafting template or VCL file that uses your normal, in-house drawing standards, and others that conform to standards imposed by your clients. Storing these in an external file and loading them as needed is convenient and a potential time saver. See Open and Save a Drafting Template.
Text, Label Instruction Text, and Leader Lines
The program offers three basic types of text: standard text, label instruction text, and smart text. You can control the font, height, aspect ratio, slant, orientation, and justification of any text object, and you can also create new text styles. Text objects also have an Auto-flip property that can be used to keep text right-side-up when it labels a feature with a variable alignment. A text object can optionally be shown with a leader line that points to its subject, i.e., the object being labeled.
There are 24 typefaces (including both serif and sans serif) that you can use to create text, smart text, and labels in both your model and on sheets.
- 20 are proportionally-spaced typefaces
- 4 are fixed-space typefaces that can be used for tables and other documents where text needs to be column-aligned. These monospace typefaces include Courier New, Lucida Console, MS Gothic, and MS Mincho.
Note: A font is a specific size and style of a typeface (also known as a "font family"). For example, Helvetical is a typeface; Helvetical Bold 14 pt is a font.
Label instruction text is text in the Sheet Set Editor that instructs the label what to display. This text does not dynamically update and should not be confused with Smart Text. See Sheet Set Layout Options for more information.
Smart text is text that can be used for displaying the page number, sheet name, and sheet count (e.g., 1/20).
Hatching and Shading/Fills
Hatching helps to highlight features made of specific materials or textures, such as concrete surfaces, drainage basins, or grassed areas. You can create hatching within the limits of selected closed boundaries.
Other Features
- Both US and European paper sizes are available when you create a sheet set.
- Drop lines used in Europe are available at the bottom of the Sheet Set Editor settings tree.
