View Machine Data
The Machine Data View automatically opens when you create any of these machine data overlays:
- Pass count details
- Pass count summary
- CMV summary
Use the Machine Data View to view and analyze the current data coming from one or more machines. The heat map in the overlay is a high-resolution image that you can zoom in to.

Prerequisites:
- Licensed module; See the Subscription Plans page. For a license matrix by command, see the License page in the TBC Community. Also see View and manage licensed features.
- Machine data overlay (selected types)
To access the view:
- Create a machine data overlay.
- Right-click on an existing machine data overlay and select Machine Data View.
| Reported values | |
|
Pass Count Details |
|
| Number of passes |
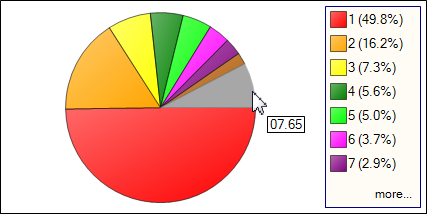
This column lists the numbers of times that any cell was traversed by a compactor (or another machine). |
| Percent area |
This lists the percentage of the area that was covered per number of passes. |
| Total coverage area |
This lists the cumulative area that was covered by all of the passes. |
|
Pass Count Summary |
|
| Constant target pass count range |
This shows the range of ideal passes per cell. Note: You can modify this range in the Create Machine Data Overlay command by expanding the On-Machine Design group and overriding the Pass count Min and Max in the Compaction Target Values section. |
| Target pass count (is) constant |
Indicates whether the pass count target was the same on all machines generating data in this overlay. |
| Percentage equals target Percentage greater than target Percentage less than target |
These rows list the percentages of cells that are above, below, and on target for pass count. Note: You can modify this range in the Create Machine Data Overlay command by expanding the On-Machine Design group and overriding the CMV Percent Targets in the Compaction Target Values section. |
| Total area |
This summarizes the cumulative square area covered by all passes. |
|
CMV Summary |
|
| Compacted Under-compacted Over-compacted |
These rows list the percentages of cells that are above, below, and on target for CMV. |
| Constant target CMV |
If target CMV was constant (see below) on all machines, this shows the shared target CMV. |
| Is target constant (?) |
Indicates whether the CMV target was the same on all machines generating data in this overlay. |
| Total area |
This summarizes the cumulative square area covered by all passes. |
|
|
|
|
|
|
|
|
|