Create and Edit a Machine Data Overlay
Use the Create Machine Data Overlay command to filter and overlay a raster image of machine data from a tag file (.tag) onto a Plan View so that you can view, analyze, and filter the current data coming from one or more machines. After creating a machine data overlay, you can create a surface from the overlay data.
Note: Overlays do not display in the 3D View or any other graphic views, except the Surface Slicer View.
Use the Edit Machine Data Overlay command to edit the filter that was previously used to create a machine data overlay. You can edit the filter to show different data by changing the area, design surface/subgrade surface, machine, or data/time range, but you can not change the overlay type.
Prerequisites:
- Licensed module; See the Subscription Plans page. For a license matrix by command, see the License page in the TBC Community. Also see View and manage licensed features.
- One or more external service accounts, such as WorksOS and/or the Machine Data Service
- External service credentials and a logged-in user profile
- Machine data on the external service
- For WorksOS data, you must have selected a WorksOS project using the Publish to WorksOS command.
Note: The colors used in a machine data overlay match the default colors used in WorksOS. If you change your WorksOS colors, they will not match the Trimble Business Center colors.
To access the commands:
- Select Create Machine Data Overlay in Construction Data > Machine Data.
- Select Edit Machine Data Overlay in Construction Data > Machine Data or right-click an overlay in the Project Explorer and select Edit.
To create a machine data overlay:
- In the Overlay name box, type a unique identifier for the overlay/filter as you want it to appear in the in the Selection Explorer and Properties pane.
- Select an option in the Overlay type list:
- Pass count details - Select this to create a heatmap of the number of times compactors (or other machines) have driven over each 0.34 m cell in the overlay. The number of passes is measured for the top-most layer of material on the surface. For compactors, this data helps you understand where under-compaction and over-compaction may have occurred. This overlay also opens a Machine Data View tab that lists (per color in the heat map) the number of passes, percent of area covered per number of passes, and the total coverage area of all passes.
- Pass count summary - Select this to create a heatmap of the percentage of cells that are above, below, or within the target pass count range. For compactors, this data helps you understand what percentage of the area is on target for pass counts. This overlay also opens a Machine Data View tab that lists (per color in the heat map) the target range, percentages of cells that are not on target, and the total coverage area of all passes.
Note: For this overlay type, you can expand the On-Machine Design group and override the range (Pass count Min and Max) in the Compaction Target Values section.
- CMV - Select this to create a heatmap of the relative stiffness of the compacted material in each cell as recorded by sensors on the compactors. This overlay also opens a Machine Data View tab that lists (per color in the heat map) the percent of area above, below, and within the target CMV range.
Note: For this overlay type, you must expand the On-Machine Design group and select CMV in the CMV Target section. Edit the CMV target value, if needed.
Note: For this overlay type, you can also override the range (Below and Above) in the Compaction Percent Targets. - CMV summary - Select this to create a heatmap of a summary of the CMV values from compactors as below, equal to, or above the target CMV value. For compactors, this data helps you understand what percentage of the area has been properly compacted. This overlay also opens a Machine Data View tab that lists (per color in the heat map) the constant target CMV, and the percentages over-, under-, and properly compacted.
Note: CMV is unique value for each machine. Because of this, the CVM Summary is calculated based on the CMV percent of target values that come from the work order.
- CMV change (multiple machines) - Select this to create a heatmap of the percentage change in CMV for more than one machine since the last measured CMV for the same machines.
Note: CMV is usually tracked against a single machine because each machine has a different CMV claibration. To track CMV for multiple machines, each machine's target CMV range needs to be normalized relative to the other machines. For single machine CMV change, values are provided only forcells that were passed over sequentially by the same machine.
- CMV change (single machine) - Select this to create a heatmap of the percentage change in CMV for only one machine since the last measured CMV for the same machine.
- Elevation - Select this to create a heatmap of the elevation of each cell. For this type of overlay, you can filter the results to specific elevations (see step 4 below).
- Cut/fill - Select this to create a heatmap that shows whether each cell is in cut, at grade, or in fill based on the difference between the overlay and a .ttm surface that is stored on the external service you are accessing (e.g., WorksOS). The cut or fill is calculated from the comparison of two surfaces which may be a mixture of filtered machine data and design surfaces.
- In the Filename list, select the .ttm surface that is on the external service. The read-only Design Info group shows the design's ID, filespace ID, and full path.
- In the Offset box, enter the vertical distance you want between the overlay and the surface for the purpose of calculating the isochore (cut/fill volume difference model).
Note: Generally you want 0.00 offset between your design surface and your overlay. You may want to specify a negative offset when you want the surface to be at the level of a specific lift below the top of the material layer that the overlay represents.
- Coverage - Select this to create a heatmap of which cells were passed over by a compactor (or another machine).
- Temperature summary - Select this to create a heatmap of summary temperature information recorded by asphalt compactors.
- Temperature - Select this to create a heatmap of temperature information recorded by asphalt compactors.
- Speed - Select this to create a heatmap of the ground velocity of compactors (or other machines)
- To limit the overlay to data from a certain area, on-machine design, or machine, expand the applicable group, check the Filter by... box, and use these options:
Note: Often you will simply want to leave these groups collapsed, select Project extents in the Date/Time Range group, and click Create.
- Area (check the Filter by area box)
- Select boundary - Move your cursor into the Plan View and pick a closed line that denotes the outer limits of the area for which you want machine data.
Tip: If needed, use the Create Boundary or Create Rectangle command to quickly create a boundary, which you can then pick.
- Select boundary - Move your cursor into the Plan View and pick a closed line that denotes the outer limits of the area for which you want machine data.
- On-Machine Design (check the Filter by machine design box)
- (design list) - Select a design surface that a machine used.
- Filter by lift number - Check this box to restrict the data to a single lift from the design surface. Select a lift from the design's material layer in the Lift number list.
- Compaction target values - This shows target values from the Trimble Business Center design on the machine (or default values (as used on the emulator) when none are in the design). If the machine operator overrode the design's targets, those overridden values are shown. Edit the values the overlay will use or click Reset Target Values as needed.
- Machines (check the Filter by machine box)
- (machine list) - Check the box for each machine's data to include in the overlay, or click Select All/None.
- Set machine direction - Select an option to restrict the heat map data to either Forward or Reverse machine direction.
- Use compactor data only - Check this box to exclude data from non-compactor machine types.
- Set vibe state - Select an option to restrict the heat map data to machines with drum vibration either On or Off during compaction.
- To limit the overlay data to data colleccted within a specific time period, select a predefined Date/Time Range in the list or use the data and time tools to set an exact range.
- Area (check the Filter by area box)
- In the Elevation Type list, select a preset filter to apply to an Elevation type of overlay:
- Highest - Select this option to restrict the elevation overlay data to cells showing the machine's highest pass over the surface.
- Lowest - Select this option to restrict the elevation overlay data to cells showing the machine's lowest pass over the surface.
- First - Select this option to restrict the elevation overlay data to cells showing the machine's initial pass over the surface.
- Last - Select this to restrict the elevation overlay data to cells showing the machine's final pass over the surface. This filter is useful for viewing excavator data that has a tendency to be bumpy because of how the arm swings.
Note: These options (which are the same in WorksOS) are best used when mapping as-built earthwork surfaces, typically as you are feeding as-built data off machines like excavators, motor graders, and dozers.
Tip: You may want to indicate the filter type in the name of your overlay, e.g., Elevation (Highest).
- Click Create.
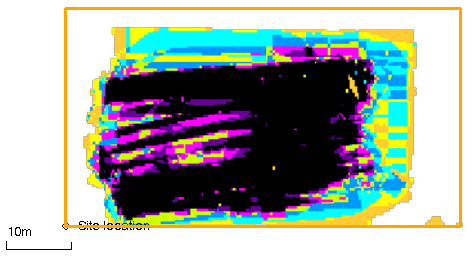
The machine data overlay is shown graphically in the Plan View in the context of the job site. Each overlay is also listed in the Project Explorer and the View Filter Manager (both under External Services)..
In addition, the Machine Data View tab opens for these overlay type:
- Pass count details
- Pass count summary
- CMV summary
To edit a machine data overlay:
- Use the options above.
- Click Apply.
Dependencies:
- None
