Monitor Point Movement
Use the TBC Monitoring module commands to supplement manual/campaign-based monitoring projects by comparing coordinates for points that have been measured in the field on multiple occasions over a period of time and imported into TBC (where they are processed and adjusted as necessary) so the cumulative data can be used to track point movement. This workflow provides an excellent method for monitoring earth or structure movement.
Note: GNSS, total station, and level point data can all be used with the Monitoring module to determine displacements. Also, point data can be imported from an ASCII file or in a third-party format supported by TBC.
This topic includes the following sections:
- Create a TBC project for the first (reference) epoch - The reference epoch is required to establish a baseline of point coordinates to which coordinates computed in subsequent epochs are compared to show point displacement.
- Create a TBC project for each subsequent epoch - Each subsequent epoch in your monitoring cloud project will compare that epoch's point coordinates with coordinates in the reference epoch and other previous epochs in the monitoring project to show point displacement over time.
- Set Warning and Alarm thresholds for monitored points - Specify displacement threshold values that, if exceeded, will result in displacement vector arrows displayed in graphic views to display in yellow (point displacement exceeds one or more Warning thresholds) or red (point displacement exceeds one or more Alarm thresholds). These colors are also used in Monitoring Point Charts when either the △2D, △3D , or △Elevation option is selected exclusively.
- View monitored point displacement - View monitored point displacement information in any of the following views:
Prerequisites:
- Licensed module. See the Subscription Plans page. For a license matrix by command, see the License page in the TBC Community. Also see View and manage licensed features.
- measured points
Create a TBC project for the first (reference) epoch:
The reference epoch is required to establish a baseline of point coordinates to which coordinates computed in subsequent epochs are compared to show point displacement over time.
- Create a new TBC project into which you will import the points you want to monitor for coordinate changes.
Each new VCE project you create for point monitoring is represented by an epoch in the monitoring project. Each epoch includes the point coordinates and time stamp specified in the TBC project.
Tip: Include the date for the current data epoch in the VCE project name to easily manage the collection of TBC project files used for monitoring.
- Import the point data for the first epoch into your TBC project. Then, process and adjust the data as applicable using the various commands in the Survey ribbon tab.
- If you have not already done so, log in to Trimble Identity so that TBC has access to the monitoring cloud, where monitor point data will be stored and synchronized.
- Create the monitoring cloud project to which you want to assign monitoring points for the first epoch as follows:
- Select Assign Monitoring Project in Monitoring > Manage to display the Assign Monitoring Project command pane.
- In the Monitoring project drop-down list, select Create new project.
- In the New project name field, enter a name for the new monitoring project.
- Click the Create Project button
The new project name is displayed in the Monitoring project drop-down list.
- In the Monitoring epoch date/time field, enter the date and time the point measurements were made in the field to assign to the new epoch in the monitoring project.
- Click the Save button.
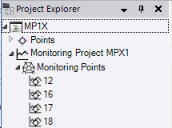
A new Monitoring Project parent node displays in the Project Explorer.
- Select the imported points you want to monitor as follows:
- Select Create Monitoring Points in Monitoring > Manage to display the Create Monitoring Points command pane.
- Click in the Points to monitor field and then use a graphic view or the Project Explorer to select the imported points you want to monitor.
- Click the Create Points button.
- When prompted to save the project before continuing, click Yes.
The synchronization process begins immediately. A Progress Bar dialog displays showing the progress of the process.
During synchronization, the monitoring points are transferred to the Trimble cloud where they are added as a new epoch to the Trimble monitoring project. The monitoring point nodes are added as child nodes to the parent Monitoring Project parent node in the Project Explorer, which turns red during synchronization and then black when synchronization is complete.
You are now ready to create a project for each subsequent epoch, as data becomes available, so that movement of the monitored points can be tracked over time.
Create a TBC project for each subsequent epoch and synchronize data:
Each subsequent epoch in your monitoring cloud project will compare that epoch's point coordinates with coordinates in the reference epoch and other previous epochs in the monitoring project to show point displacement over time.
- Create a new TBC project into which you will import the points you want to monitor for coordinate changes.
Each new VCE you create for point monitoring is represented by an epoch in the monitoring cloud project. Each epoch includes the point coordinates and time stamp you specify in the TBC project (see step 4 below).
Tip: Include the date for the current data epoch in the VCE project name to more easily manage the collection of TBC project files used for monitoring.
- Import the point data for the epoch into your TBC project. Then, process and adjust the data as applicable using the various commands in the Survey ribbon tab.
Note: It is important that the names of the points being monitored do not change from epoch to epoch.
- If you have not already done so, log in to Trimble Identity so that TBC has access to the monitoring cloud, where monitor point data will be stored and synchronized.
- Select the monitoring cloud project to which you want to assign monitoring points for the epoch as follows:
- Select Assign Monitoring Project in Monitoring > Manage to display the Assign Monitoring Project command pane.
- In the Monitoring project drop-down list, select the monitoring cloud project that contains the prior epoch data (see "Create a project for the first (reference) epoch").
- In the Monitoring epoch date/time field, enter the date and time the point measurements were made in the field to apply to the new epoch in the monitoring project.
- Click the Save button.
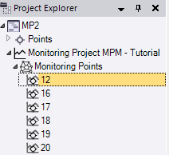
The Assign Monitoring Project command pane closes, and a new Monitoring Project parent node displays in the Project Explorer. Nested beneath it are nodes representing each of the monitoring points downloaded from the monitoring cloud project.
- Select the points you want to monitor as follows:
- Select Create Monitoring Points in Monitoring > Manage to display the Create Monitoring Points command pane.
The monitoring points created for the prior epoch are automatically selected; however, you can change the selection if necessary. Note that if you select a point that has not already been saved to the monitoring cloud project in a previous epoch, it will not display any movement in the various point monitoring views. The point must be included in at least two synchronized epochs to show point movement in the various monitoring views, spreadsheets, and reports.
- Optionally, click in the Points to monitor field and then use a graphic view or the Project Explorer to add or remove any of the points you want to monitor.
- Click the Create Points button.
- When prompted to save the project before continuing, click Yes.
The synchronization process begins immediately. A Progress Bar dialog displays showing the progress of the process. All of the monitoring nodes are red during synchronization and change to black when synchronization is complete.
- Select Create Monitoring Points in Monitoring > Manage to display the Create Monitoring Points command pane.
- Repeat this procedure as necessary to add more epochs to the monitoring project as data becomes available.
After creating TBC projects for two or more epochs, you can view displacement information for the selected monitored points as described in the following sections of this topic:
- View monitoring: Properties pane
- View monitoring: Plan View and 3D View
- View monitroing: Monitoring Point Chart
- View Monitoring: Monitoring Points Spreadsheet
- View monitoring: Monitoring Report
But before you do, you might want to change Warning and/or Alarm thresholds for one or more of the monitored points as described in the next section: "Set Warning and Alarm thresholds for monitored points".
Set Warning and Alarm thresholds for monitored points:
Specify Warning and more severe Alarm threshold values that, if exceeded, will result in color coding being applied to point displacement vector arrows displayed in graphic views.
By default, displacement vector arrows are colored as follows. However, you can change any of the colors used in Project Settings> View > Monitoring.
- Green = The point displacement is within Warning/Alarm thresholds.
- Yellow = The point displacement exceeds one or more Warning thresholds, but does not exceed any Alarm thresholds.
- Red = The point displacement exceeds one or more Alarm thresholds.
Note: If either the △2D, △3D, or △Elevation option is selected exclusively in the Monitoring Point Chart, the chart is shaded to show coordinates that exceed the specified Warning threshold (yellow) or Alarm threshold (red).
To set Warning and Alarm thresholds, do either of the following in the latest epoch project:
- In the Project Explorer, select one or more monitoring points whose thresholds you want to edit and select Properties to display the Properties pane. Then, edit any of the Warning Thresholds (less severe) and Alarm Thresholds (more severe).
- Select Monitoring Points Spreadsheet in Monitoring > Deliverables. Then, edit any of the Warning Thresholds (less severe) and Alarm Thresholds (more severe).
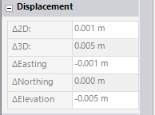
View monitoring: Properties pane
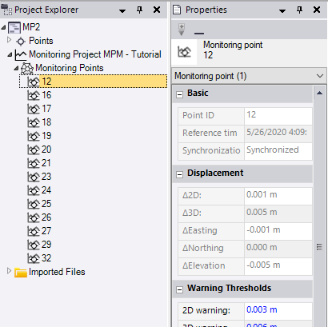
Right-click a monitoring point's node in the Project Explorer and select Properties to display the point's Properties pane.
The Displacement section of the pane shows the read-only displacement values for the current point coordinates when compared to the first (reference) epoch in the monitoring project.
View monitoring: Plan View and 3D View
Select the Plan View tab or 3D View tab to view vector arrows indicating the direction and distance of point displacement when compared to the reference epoch.
By default, displacement vector arrows are colored as follows. However, you can change any of the colors in Project Settings > View > Monitoring.
- Green = The point displacement is within Warning/Alarm thresholds.
- Yellow = The point displacement exceeds one or more Warning thresholds, but does not exceed any Alarm thresholds.
- Red = The point displacement exceeds one or more Alarm thresholds.
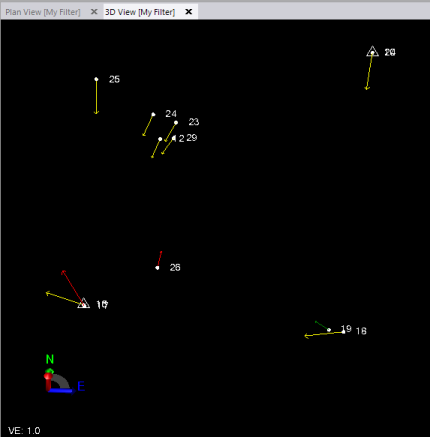
Note: If displacement vector arrows are too small or too long to view easily, you can adjust the arrow size using the the View > Monitoring > Maximum displacement arrow length on screen setting in the Project Settings dialog.
View monitoring: Monitoring Point Chart
In the Project Explorer, select the monitoring point whose displacement you want to view and do either of the following:
- Right-click and select Show Monitoring Chart.
- Select Show Monitoring Point Chart in Monitoring > Deliverables.
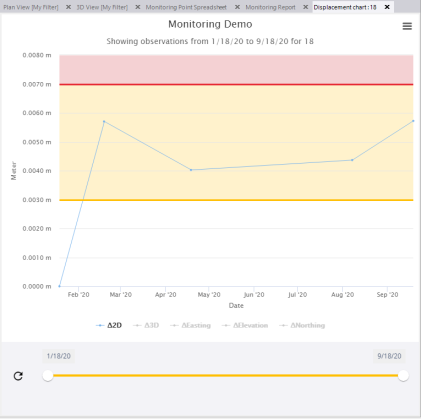
The Monitoring Point Chart displays displacement values along a scrollable timeline. The chart provides a simple visual tool for determining trends in a single point's movement in its separate components, which are listed as display options along the bottom of the chart. Just click to hide or show any option or combination of options.
Use the Chart context menu located in the upper-right corner of the chart to print the chart to a printer or PDF file, or select to save the chart as an image.
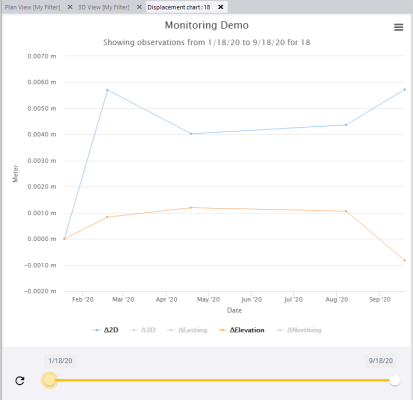
If either the △2D, △3D, or △Elevation option is selected exclusively, the chart is shaded to show coordinates that exceed the specified Warning threshold (yellow) or Alarm threshold (red).
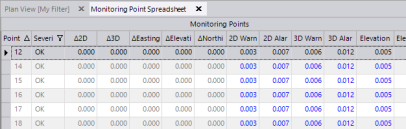
View monitoring: Monitoring Points Spreadsheet
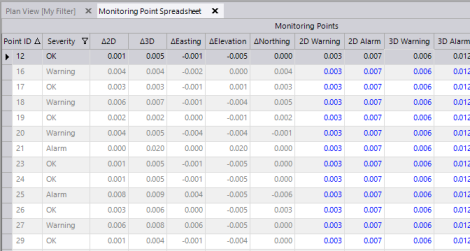
Select Monitoring Points Spreadsheet in Monitoring > Deliverables.
The Monitoring Points Spreadsheet includes point displacement values for all monitoring points in the project, along with Warning/Alarm statuses and editable Warning/Alarm threshold values.
As with all spreadsheets in TBC, you can use the built-in controls to sort by column headings, hide columns, copy rows, and make selections.
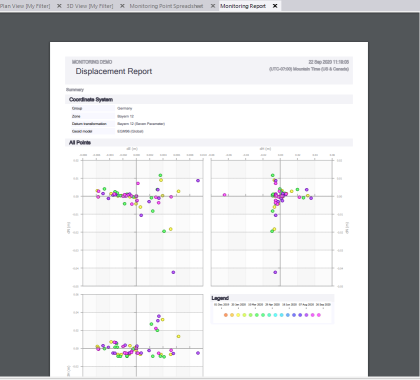
View monitoring: Monitoring Report
- Select Show Monitoring Report in Monitoring > Deliverables.
- In the Show Monitoring Report command pane, do the following:
- Click in the Monitoring Points field and then select the monitoring points you want to include in the report.
- Optionally, check the Specify time period check box and enter the date range from which you want to include epochs in the report.
Otherwise, all epochs in the project will be included.
- In the Report Elements group box, check the elements you want to include in the report.
- In the Displacement dimension drop-down list, select the type of displacement values you want to show in the report: 1D, 2D, or 3D.
- Optionally, to include a logo image in the report, click the Search button located to the right of the Report Logo field and select the graphic image you want to include.
- Click the Generate button.
The Monitoring Report contains complete displacement information for the entire monitoring project using tables, charts, and scatter plots.
As with all reports in TBC, you can use the the controls located at the top of the report to download the report as a PDF file or print it to a printer.