Run a Boeing Bump Index (BBI) Report
Use the Boeing Bump Index Report command torun a report that evaluates the condition of a runway or other airport surface based on the Boeing Bump Index (BBI) standard. This pavement analysis can help you determine when and where airfield maintenance is needed.
Unlike general road indexes (like the International Roughness Index), the BBI focuses on individual surface irregularities based on their wavelength (length) and amplitude (height). Bumps are classified into three categories: acceptable, excessive, and unacceptable.
Note: This TBC report adheres to the Advisory Circular by the Federal Aviation Administration (FAA) in which parameters, such as sampling frequency, are predefined.
Prerequisites:
- License; See the Subscription Plans page. For a license matrix by command, see the License page in the TBC Community. Also see View and manage licensed features.
- High-quality scans of a runway surface
- Alignment or linestring defining the centerline of the same runway
To access the command:
- Select Boeing Bump Index in Mobile Mapping > Analysis.
Options:
- Path - From the box, select in the Project Explorer or pick in the Plan View the alignment from which to create offset left and right wheel paths and a BBI analysis.
- Profile offsets
- Center - Enter the distance to offset the path of the aircraft's center from the selected alignment path.
- Left/Right - Enter the distance to offset the wheel path linestrings from the selected alignment path. Once you enter offsets and run the report, you will see the wheel paths in your Plan View (there is no preview before running the report).
Note: A wheel path to the left of the selected path has a negative value by default. To generate both paths to the right, remove the minus sign from the Left value.
Note on Setting persistence: Many values you specify are saved not with the project, but as an application setting with your user profile; the next time you run the command on a different project, your preferred settings will be populated.
- Drape profiles on - Select a portion of a point cloud in a graphic view.
See Add Scan Points to Point Cloud Region and/or View and Edit Point Cloud Regions for details.
- Deliverables
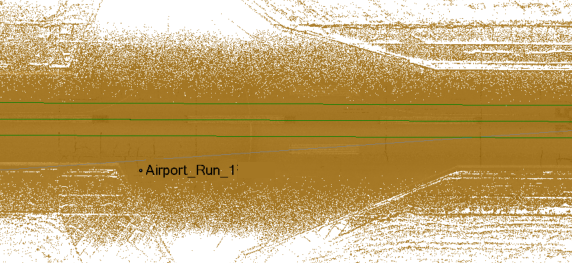
- Create CAD lines - Check this box to create three linestrings (one per virtual aircraft wheel path, plus one centerline) when you click Calculate (if the Center offset is left at 0, that center linestring will overlap the main path you originally selected), which can be color-coded based on severity. The linestring colors (green, red, or yellow offset from the path) are based on the specified thresholds. The created ‘CAD lines’ are draped on the selected point cloud or surface using real elevation values to determine the roughness of the runway. You can export the lines to Trimble Access or other software to stake out must-grind locations in the field.
Note: When this is enabled, the wheel paths are split into multiple individual linestrings. The line breaks exactly where the BBI category changes (e.g., from Acceptable to Excessive). Each newly created linestring segment represents a specific BBI zone.
Tip: Each time you run the report with this option enabled, new linestrings are created. To avoid creating multiple linestrings, delete previous lines or uncheck this box on subsequent runs.- Layer - Select the layer on which you want any created CAD lines to reside.
- Color by BBI values - Use BBI values to color-code each created CAD line. Values in the acceptable range are shown in green. Excessive and unacceptable BBI values are shown in yellow and red, respectively.
- Create Excel report - Open the BBI report as a Microsoft® Excel sheet (.xlsx) after calculating the analysis along the virtual wheel paths.
Note:If you do not have Excel installed, TBC will still create a simple report that you can open directly in Google Sheets or another spreadsheet viewer.
- Open after creating report - Open the report in Excel after creating the report. Leaving this box unchecked allows you to create the .xlsx file without TBC trying to open it in Excel.
- Save segment scores in: New sheet or New workbook.
- Create CAD lines - Check this box to create three linestrings (one per virtual aircraft wheel path, plus one centerline) when you click Calculate (if the Center offset is left at 0, that center linestring will overlap the main path you originally selected), which can be color-coded based on severity. The linestring colors (green, red, or yellow offset from the path) are based on the specified thresholds. The created ‘CAD lines’ are draped on the selected point cloud or surface using real elevation values to determine the roughness of the runway. You can export the lines to Trimble Access or other software to stake out must-grind locations in the field.
|
Report Sections on Excel Tabs Note: For technical explanations of BBI parameters, see the FAA's Advisory Circular. |
|
|
Summary |
Shows metadata on your project, coordinate system, centerline path, offset paths, and report range based on the start and end stations of the selected alignment. Path - Names the alignment along which the BBI values are calculated. Start/End Station - Shows the distance along the alignment at which BBI was analyzed. |
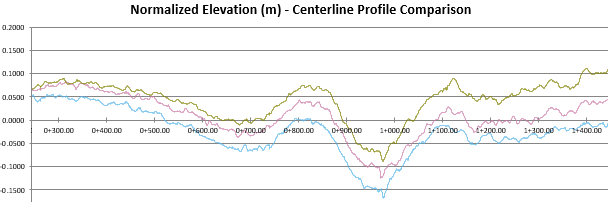
| Profile Comparison |
Shows 2D coordinate graphs of both Normalized Elevation and BBI:
|
| Left/Right/Center |
2D coordinate graphs are plotted on three tabs to show the roughness of the runway surface based on Bump height, Bump length, and Straightedge length on Right, Center, Left paths. |
