Custom view tooltips
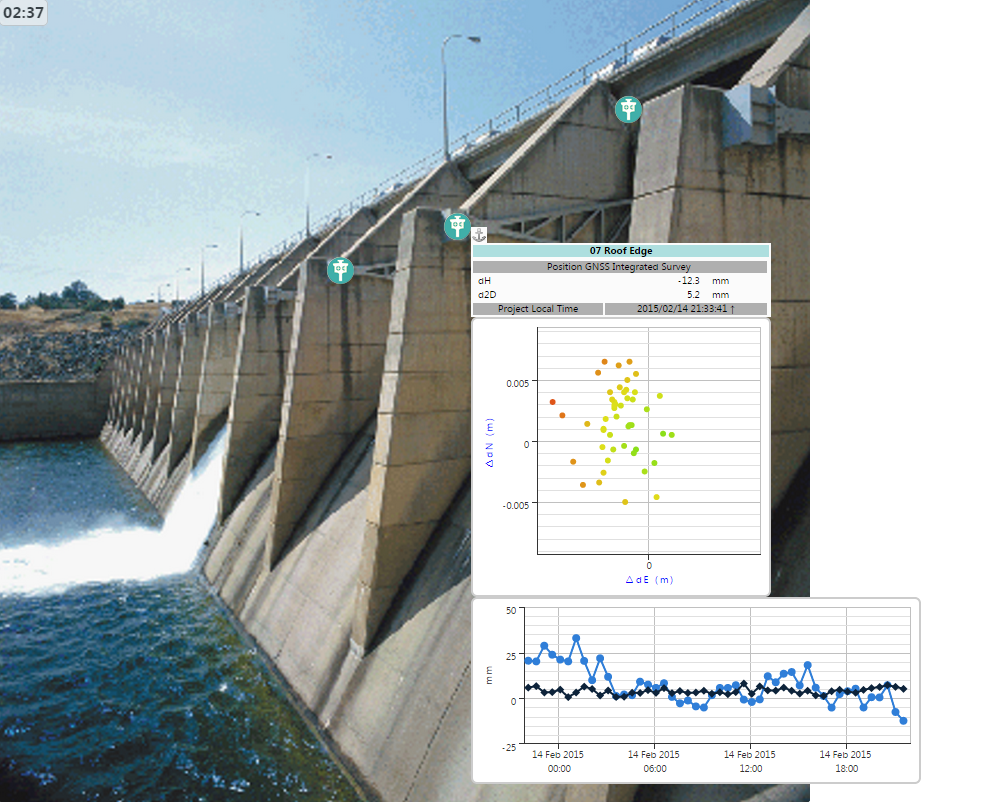
The custom view provides a tooltip (popup textbox) for each sensor. Each tooltip can provide up to three display components:
-
Latest observations (the same as in the Maps section)
-
Chart
-
Scatter plot
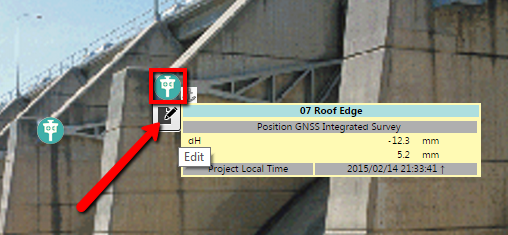
To enable these display components:
-
Click the Edit icon that appears when you hover the mouse cursor over the sensor icon:
-
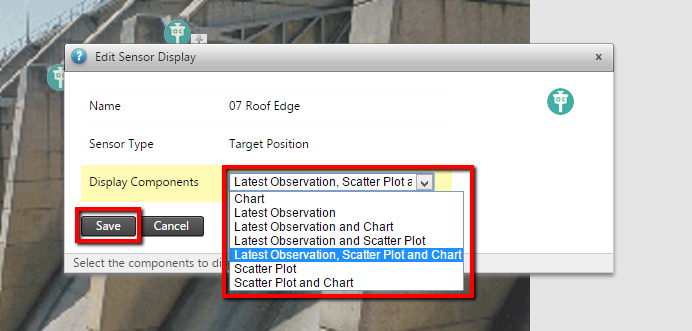
Select the option or the combination of options to be displayed in the tooltip. The sensor tooltip will then display the configured components.
-
You can click a sensor to anchor the tooltip to stay in place.
In this example all three components are configured: latest observations, chart and scatter plot.