IPI chart settings
The collapsible Controls Area contains controls that can be used to adjust the presentation of the IPI chart.
Provided that you have edit permissions for the IPI page, all settings (except for the Date Range) persist for each IPI chain.
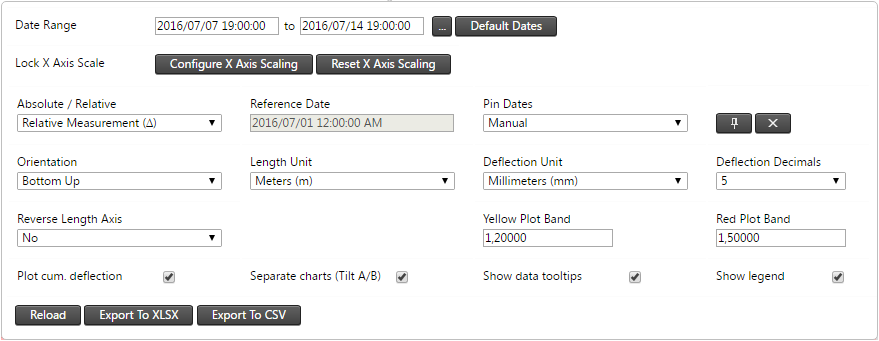
Date Range
The Date Range controls on the IPI chart work the same as in all other charting areas (for example, Charts, Scatter plot and Analysis).
Lock Axis Scale
The Lock Axis Scale controls can be used to adjust the Deflection scale. This might be the X or the Y axis of the chart, depending on the IPI Chart Orientation.
Click Configure X (or Y) Axis Scaling to set up the scale extents. Click Reset X (or Y) Axis Scaling to remove the extent presets.
Absolute / Relative
IPI charts can be plotted in Absolute or Relative mode.
An Absolute IPI chart plots the IPI chain with actual tilt and deflection values.
A Relative IPI chart plots the difference between the actual tilt and deflection values at a given time vs a reference point in time. Relative IPI charts make use of the Reference Date defined for the project or for a specific sensor.
Pin Dates
By default the IPI chart loads with only a single series - known as the active series. This series is tied to the date slider at the bottom of the page and changes to reflect the state of the IPI chain as the slider is dragged left or right.
Additional pinned series can be added to the IPI chart. A number of automatic Pin Date Modes are available. These are:
-
Every Hour
-
Every Day
-
Every Week
-
Every Month
-
Every Three Months
-
Every Six Months
-
Every Year
Alternatively, you may set the Pin Date Mode to Manual. To pin a specific date, drag the time slider at the bottom of the page and click the Pin icon. This state remains pinned even if the time slider is dragged to a different time.
To clear Manual Pin Dates, click the Cross icon (next to the Pin icon).
Orientation & Reverse Length Axis
IPI charts can be rendered with 4 different orientations:
-
Bottom Up
-
Top Down
-
Left to Right
-
Right to Left
By default the fixed end of the IPI chain coincides with the zero mark on the Length axis. However, the scaling of the Length axis can be reversed using the Reverse Length Axis setting.
The labels on the form controls refer to a Length axis. Depending on the Orientation, the actual label of this axis on the chart surface is denoted as Depth, Height or Distance.
Deflection and Length Units
The preferred units for the Deflection Axis and the Length Axis can be set separately. The available options will depend on the linear Unit Preference as set on the project.
The labels on the form controls refer to a Length axis. Depending on the Orientation, the actual label of this axis on the chart surface is denoted as Depth, Height or Distance.
Deflection Decimals
The number of decimals used for plotting deflection values can be adjusted. This setting will also apply to values shown in the tooltips.
Yellow & Red Blot Bands
The Yellow Plot Band and Red Plot Band values can be used to render plot bands against the Deflection axis. These plot bands can be cleared by clearing the values or by setting it to zero.
Plot Cumulative Deflection
By default, the IPI chart will plot the cumulative displacement - obtained by adding the displacement at each node up to a particular node. Clear the Plot cum displacements check box to plot the individual node displacements only.
Separate Charts
The IPI chart plots deflection in the A and B planes onto separate surfaces. To plot the chains on the same charting surface, clear the Separate charts (Tilt A/B) check box at the bottom of the page.
Show Data Tooltips
Tooltips can be enabled or disabled using the Show data tooltips check box.
Show Legend
You can show or hide the chart legend(s) by selecting or clearing the Show legend check box.
Export
You can export IPI data to Excel or CSV format using the Export buttons at the bottom of the controls area.
