Scatter plot
Use a scatter plot to visualize changes in positional observations. The plotted X and Y axis can be adjusted to visualize movement in the various planes. For convenience, the Trimble 4D Control Web scatter plot shows two scatter plot charts next to each other so that you can visualize the movement in two planes side-by-side.
To view the Scatter plot area, select Scatter plot from the Charting and Analysis menu or click Scatter plot in the Home page.
The sensors available for scatter plots are listed in the left sidebar navigation. These are sensors with Positional Data Types. You can filter the list of sensors shown using the filter controls similar to Charts. Click one of the listed sensors to view the scatter plot.
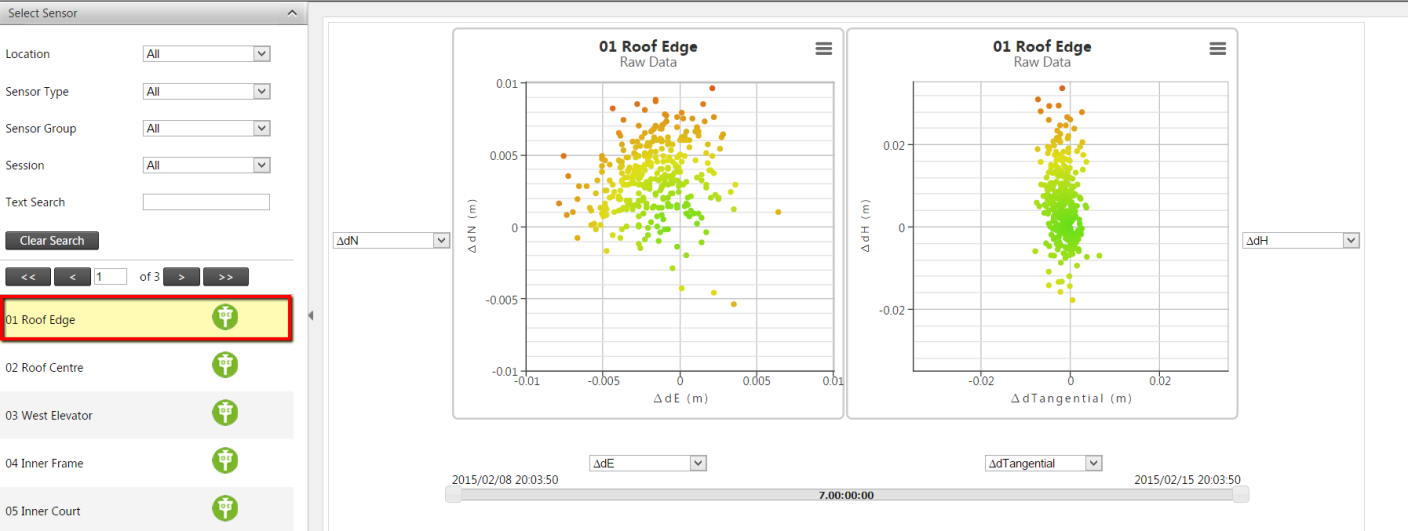
Click one of the sensors in the sensors list to display the scattor plot data on the right. For more information, see Using the scatter plot.
