Navigation
When you log into The Trimble 4D Control Web Interface, the first page you see is the Home page.
The Trimble 4D Control Web interface can be navigated either via the icons with pictures on the Home page or via the main menu at the top of the pages.
Below is a typical display of the Trimble 4D Control Web interface.
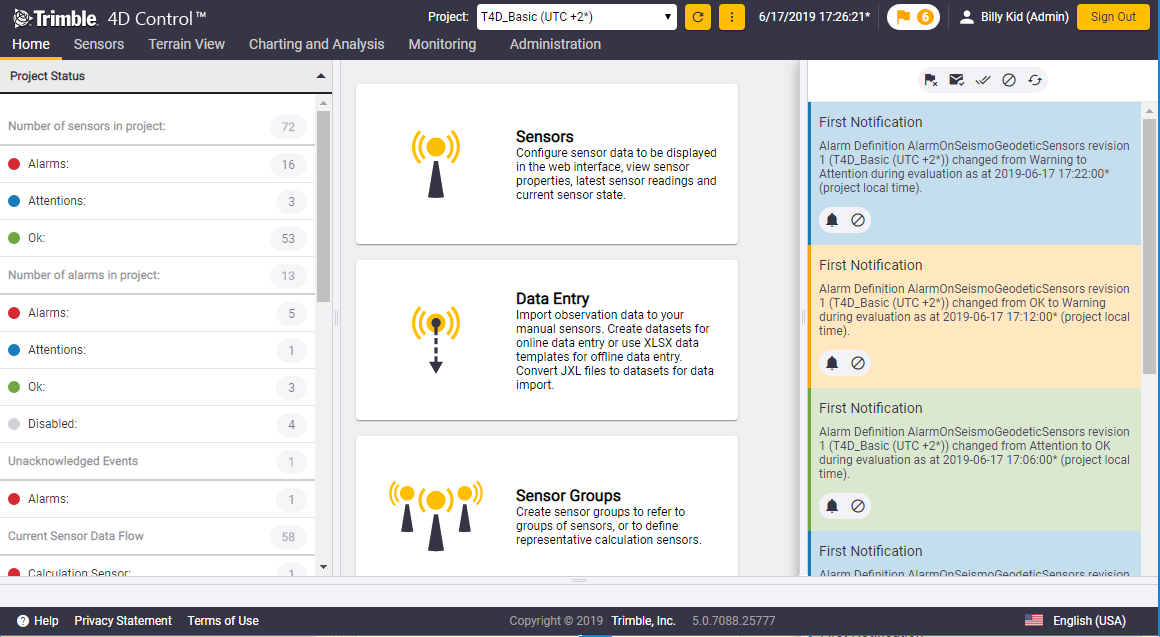
Note the different control areas on the Home page:
-
status bar
-
main menu (across the top of the screen)
-
control panel (containing the project status)
-
content panel (containing the Home page content)
-
notification panel Below we will present the areas used for navigation
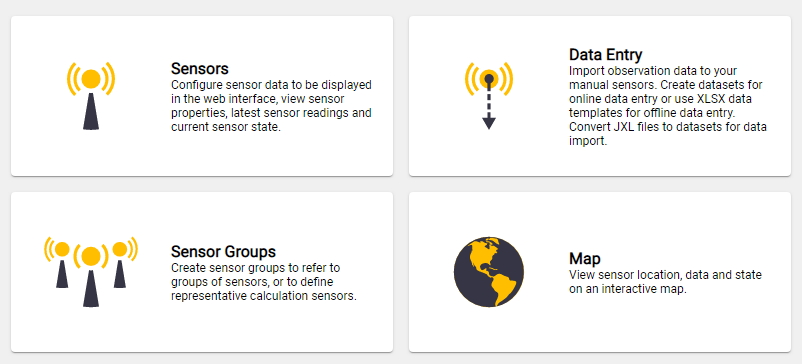
The content panel on the Home page shows clickable tiles that take you to the rest of the site. Each tile provides a short description of the functionality available in the particular area.
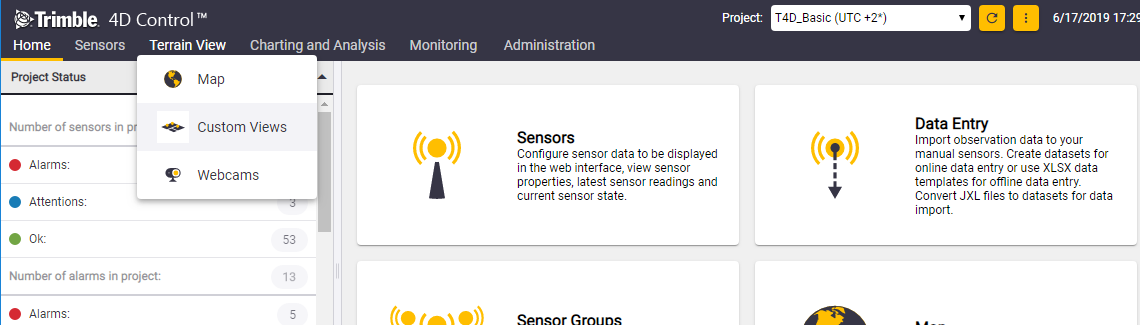
You can also navigate Trimble 4D Control Web using the main menu located at the top of the page.
Hover over a menu entry to see the child menu items.
Every Trimble 4D Control Web Web page has a Control Panel in the left panel.
The Control Panel in the example below has bar tabs with additional options (Quick Select, Select Parameters and Configuration). These bar tabs may differ from page to page. To hide the Control Panel, click the panel collapse arrow (indicated by the red arrow).
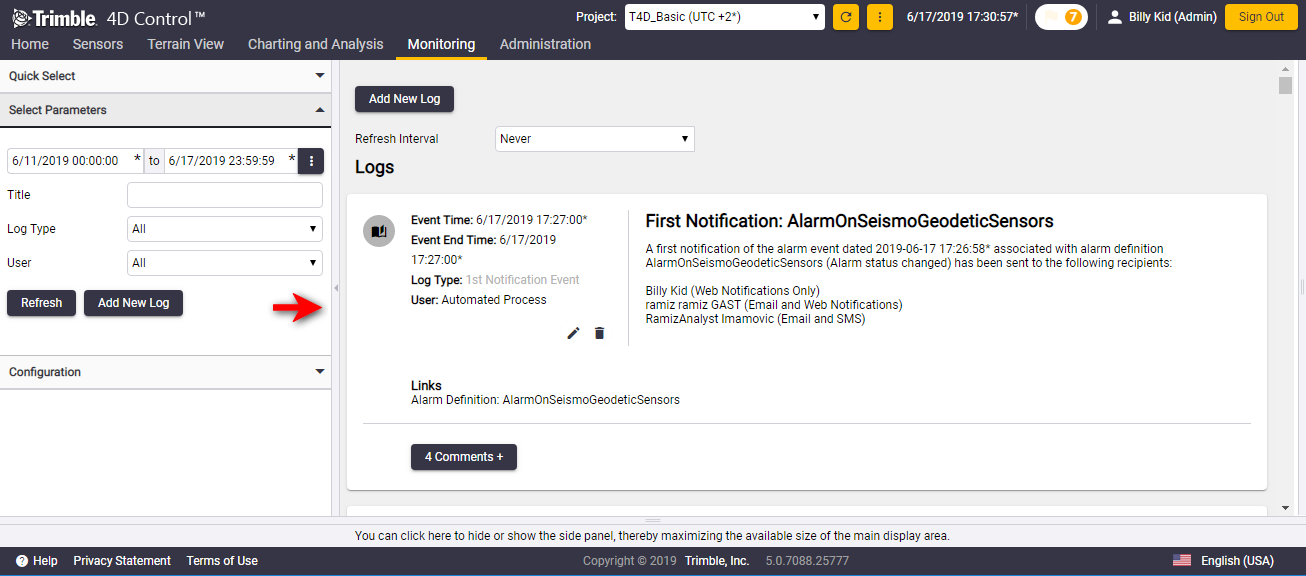
Visible tabs in the Navigation Bar or Control Panel depend on the role of the logged in user. Administrators have more options available than Analysts for example. If you do not see all the options, it is most likely because your user role does not have access to the functionality on these tabs.
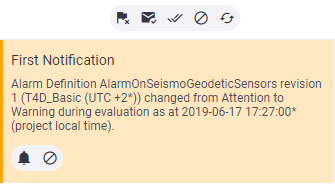
The Web Notifications Panel is displayed on the right. Normally this panel is not visible. To open or close the web notifications panel, click the flag icon on the main menu next to your user name.

The web notifications panel is usually displayed over the content area of the page you are viewing, so the intention of the web notification panel is not for it to be kept open.
The web notifications panel shows alarms and events to the currently logged in user. You can click on the buttons presented by the web notifications panel to acknowledge or navigate to event related information.
Select the project you want to view from the Project drop-down menu above the main menu.
The time displayed adjacent to the project is the Project Local Time. This is the time at the physical site being monitored.
To take daylight savings into account you must configure the daylight savings setting for the project time. See Time zone and daylight savings settings.
