T4D Rail Module User Manual
Introduction
Key Benefits and Applications
Rail Monitoring is becoming increasingly important in today's environment with the fast-growing demand for energy-efficient modes of transport. Understanding the behaviour of rail track geometry is essential to ensuring the safety of railway traffic, whether in areas where construction is taking place, regions prone to natural hazards, or where aging infrastructure is awaiting renewal. The purpose of track monitoring is to record railroad track geometry data before, during, and after the completion of construction or to make sure that the track geometry stays stable. The reference geometry data is constantly compared to the newly calculated data to determine if the track's geometry has been adversely affected. If the track geometry has been affected, the data can be used to alert the stakeholders to take appropriate action and reestablish design or as-built conditions. Trimble 4D Control offers the possibility to monitor the most important rail track geometry parameters, which helps maintain high rail safety standards.
Selecting left and right rail as optional parameters to be monitored
Rail Monitoring Parameters
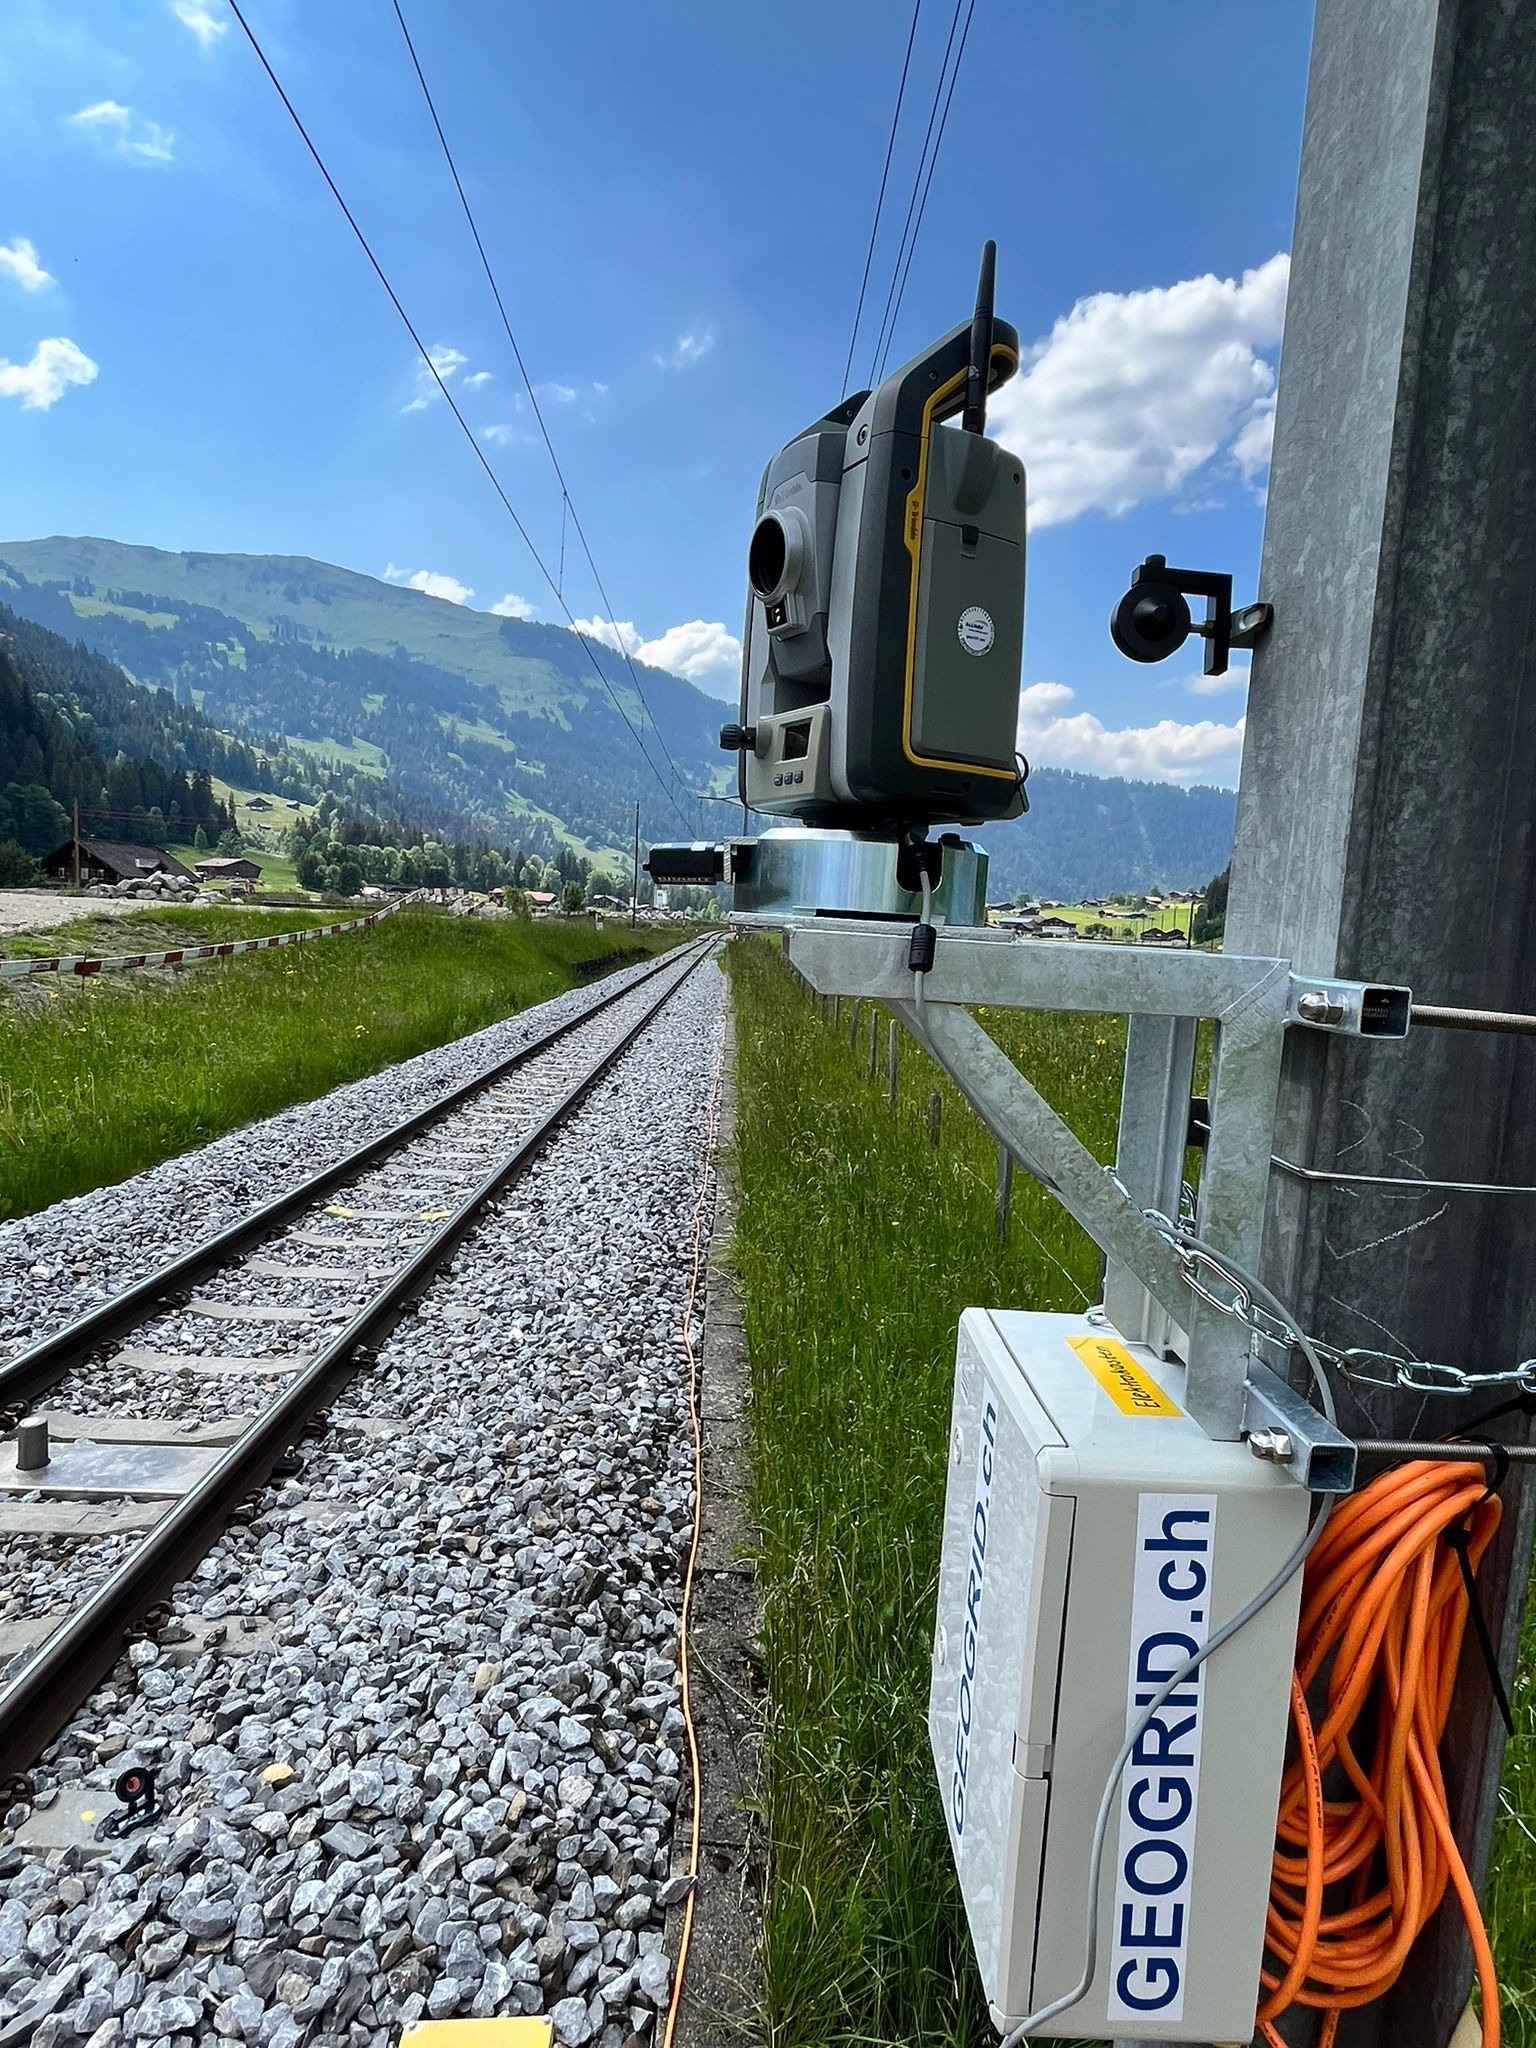
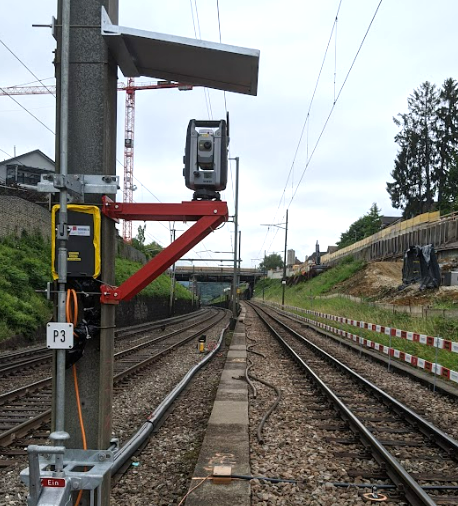
As a sensor for rail monitoring purposes, AMTS (Automated Monitoring Total Station) and prisms or Tiltmeters can be used.
In case of AMTS being used, the total station measures the prisms installed/glued on the sleeper or installed/mounted on the rail (see section Rail Monitoring prism solution). These prisms are used as prism pairs on the specific distance along the track, called chainage, to calculate the rail monitoring parameters (see below).
In case tiltmeters are used, they are installed on sleepers at a defined distance between them.
Cant
Cant is the difference in elevation between the top of the two rail heads at a chainage. Cant is calculated as the top of the left rail elevation minus the top of the right rail elevation.
Twist
Twist is the difference in cant between two chainages.
When expressed in ‰ or %, the twist is calculated as the cant value of the chainage ahead minus the cant value of the previous change and then divided by the distance between the two chainages.
When expressed in one of the units of length, the twist is calculated as the cant value of the chainage ahead minus the cant value of the previous change.
Twist as a gradient is expressed as a ratio, e.g., 1 in 100 means a rise of 1 unit over a distance of 100 units.
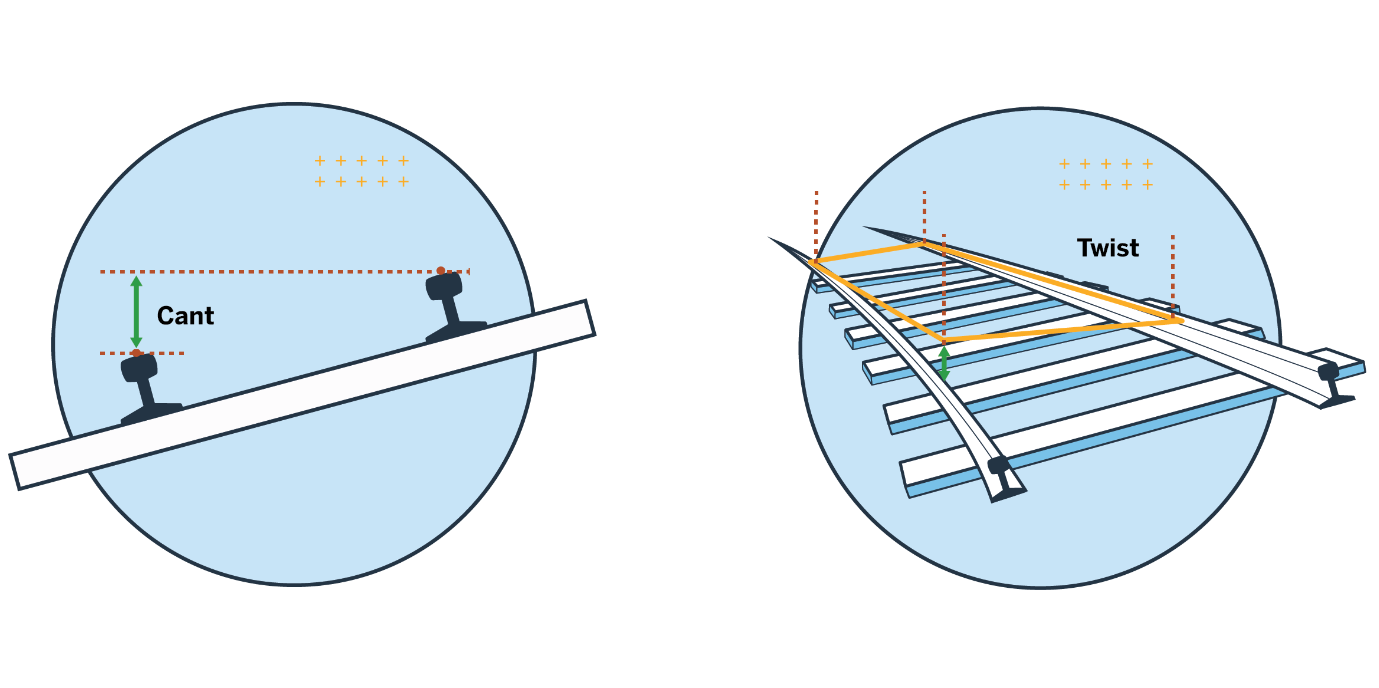
Illustration of cant and twist
Horizontal Displacement
Horizontal displacement is the change in the track's position laterally when compared to the reference epoch. Horizontal displacement can be calculated for the track centerline, left rail and right rail.
Vertical Displacement
Vertical displacement is the change in the track's elevation when compared to the reference epoch. Vertical displacement can be calculated for the track centerline, left rail and right rail.
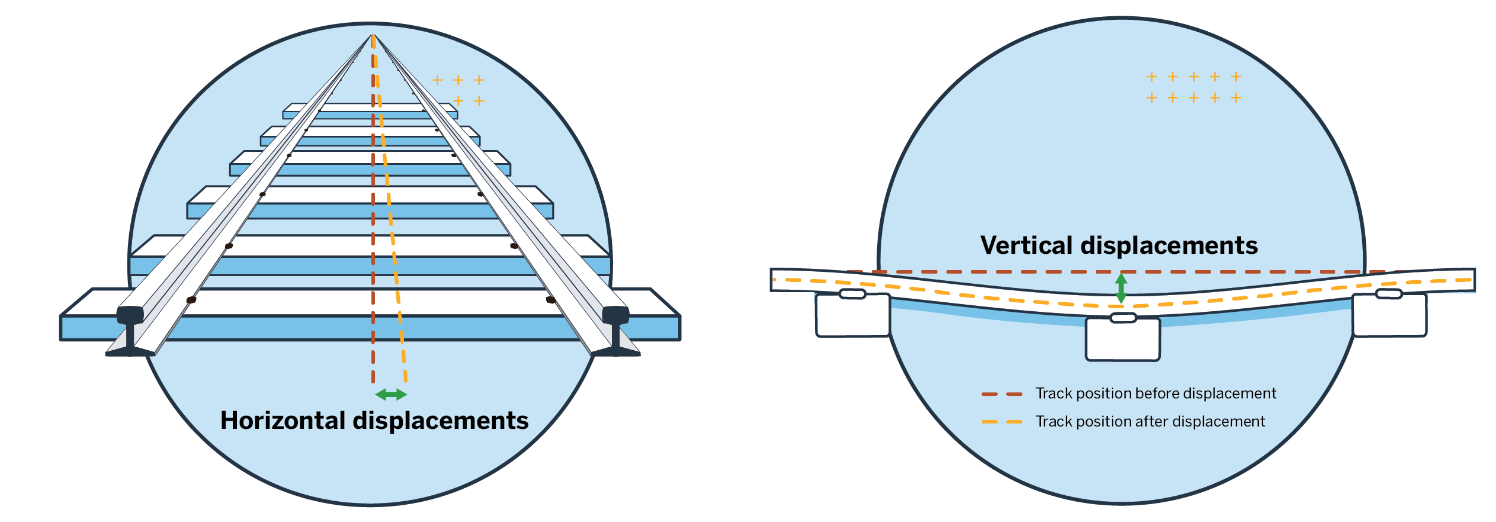
Illustration of horizontal and vertical displacement of the track's centerline
Horizontal Versine
In addition to horizontal displacements, Horizontal Versine can also be monitored. Horizontal Versine is the variation in the track's horizontal position over a certain distance (chord length).
Horizontal Versine Displacement
Horizontal Versine Displacement is the variation in the track's horizontal displacements over a certain distance (chord length). Horizontal versine is calculated as the horizontal displacement at the chainage minus the average horizontal displacement for its two neighboring chainages.
Vertical Versine
Vertical versine is the variation in the track's elevation over a certain distance (chord length). Vertical versine is calculated as the elevation of the track's defined axis at the chainage minus the average elevation of the track's defined axis for its two neighboring chainages.
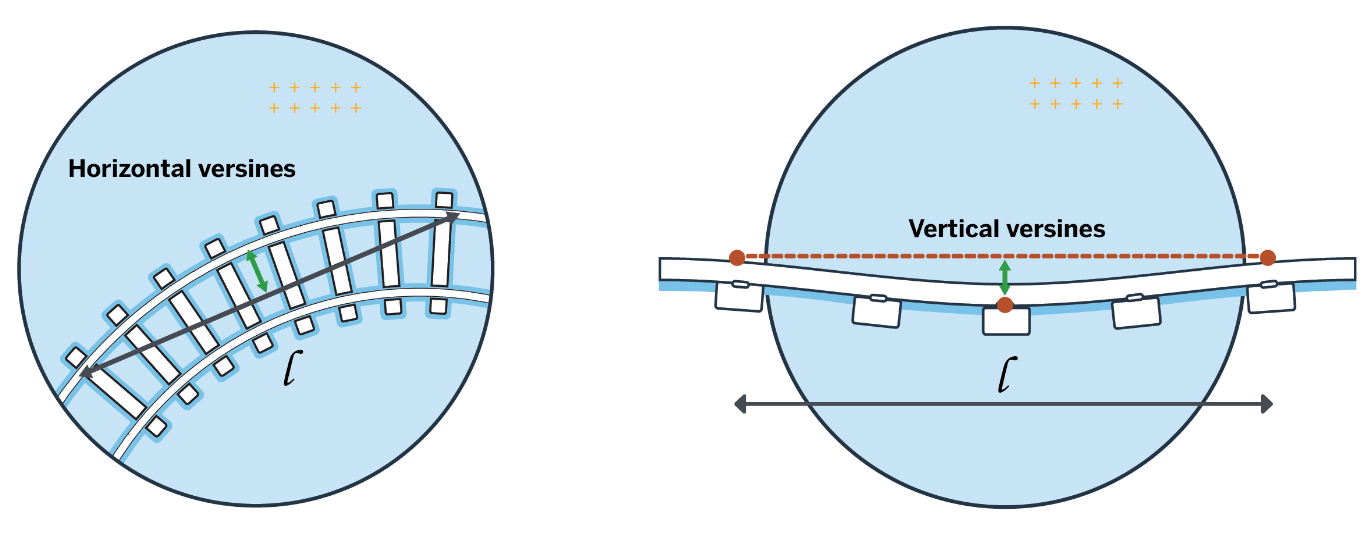
Illustration of horizontal and vertical versine
Observation age
Additionally to the rail geometry parameters, it is possible to monitor or display the Observation age of the measurements. In the rail industry, it can happen that one or more monitoring prisms were not measured due to various reasons, including passing trains, prisms being blocked or destroyed, etc.
The Trimble 4D Control Rail module offers the possibility to see and monitor how old the measurement is, which is used to calculate the rail parameters. Observation age is calculated as the time between the current calculation date and the date of the latest available measurement of a particular prism. Depending on the project specifications, you can create time thresholds to be alerted when unwanted old measurements are being used for the calculations.
As of version 6.5, in case the Observation Age parameter has reached the Alarm threshold, the parameter calculation will stop to avoid unwanted old measurements being used for the parameter calculation.
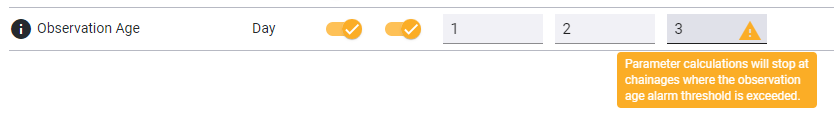
Observation Age parameter thresholds
Standard Deviation Filter Now Available in T4D Rail
The Coordinates Standard Deviation Filter is available in the T4D Rail parameter section to support high-quality results. This feature allows users to filter coordinates based on their precision. If the standard deviation of any coordinate component (Northing, Easting, or Height) exceeds the defined limit, that coordinate is automatically excluded from parameter calculations.
Users can also configure the Observation Age parameter to determine if the last available observations should be used and define the maximum allowed age for these observations.
This filter is particularly helpful for maintaining calculation integrity in scenarios involving moving backsight points, network adjustments, or missing backsight points in the case of resection.
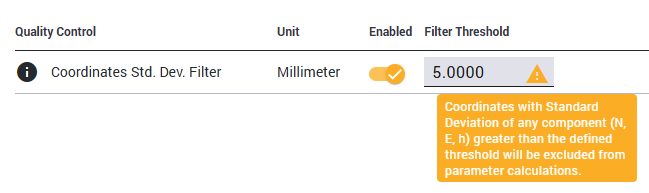
Standard Deviation Filter in T4D Rail
As-built survey - Trimble Access Track Gauge Survey app
Introduction and key functionality
Track Gauge Survey app is the field software integrated into Trimble Access for Windows operating systems used for measuring track parameters. After completing the station setup using coordinated reference points, the coordinates of the track center line, left and right rail, gauge, and cant can be measured with the track gauge bar.
As-built survey - Trimble GEDO CE 2.0 measurement system
Another solution for collecting the as-built survey data is using the GEDO Trolley in combination with Trimble S Series instruments, Trimble Access Rail GEDO Rec or GEDO Track app. The Trimble GEDO CE 2.0 track measurement trolley is the main unit of the modular Trimble GEDO track measurement systems, which can be used for geodetic track surveying. It consists of the Trimble GEDO CE 2.0 track measurement trolley with a Trimble control unit in combination with a Trimble total station. The same applies to the Trimble GEDO Track system, and the only difference is that the correction values (if the design data is available) are displayed live on-site when using the GEDO Track app.
GEDO Office is a software used for further analysis and processing of TA Rail GEDO Rec and Track measurements. This is where the *.track file, necessary for monitoring purposes, can be exported.
Further information regarding the GEDO measurement system can be found at https://gedo.trimble.com/en. Detailed information, manuals, support notes, and more can be found in the Download Center. Registration is necessary.
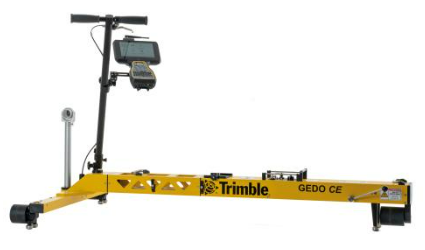
GEDO CE 2.0 measurement system
Rail Monitoring prism solution
There are four recommended ways to install the prisms for rail monitoring purposes. The user has the flexibility to install the prisms based on the applicable environment, project, or country specifications.
One of the solutions is gluing the prisms on the rail itself. Using the mounting plate, the prisms can easily be fixed on the rail by means of mounting adhesively. After the monitoring project is finished, the prisms can be removed easily and, if needed, re-affixed. A similar approach to this one is fastening the magnetic prisms directly on the rail.
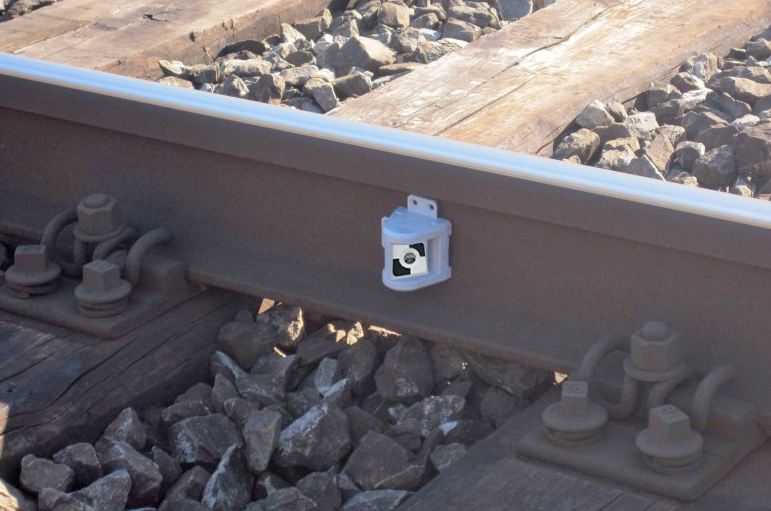
Prism glued on the rail
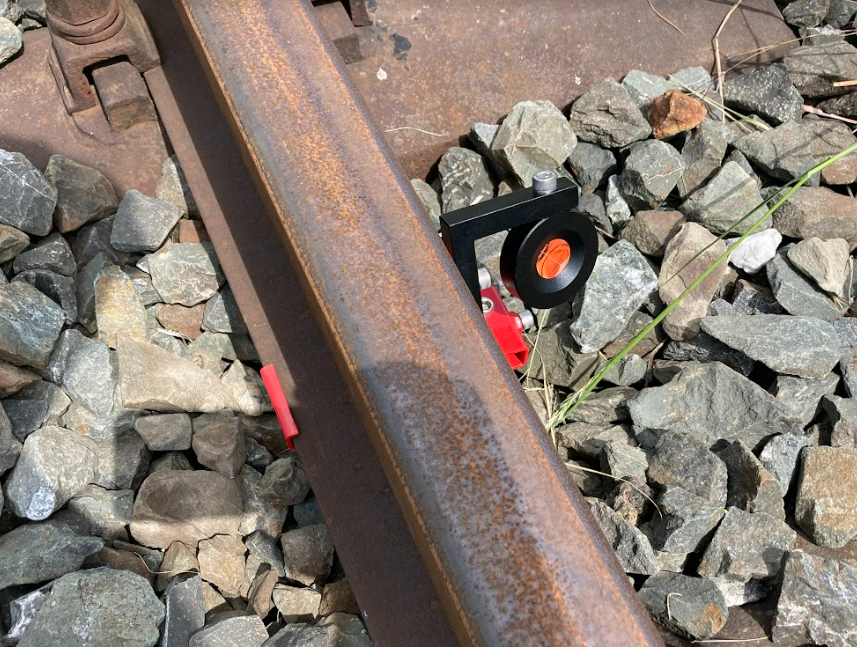
Another way is fixing the prisms on the sleeper. Depending on the type of sleeper (steel or concrete), the prisms can be screwed or glued on the sleeper.
Prism glued on a steel sleeper
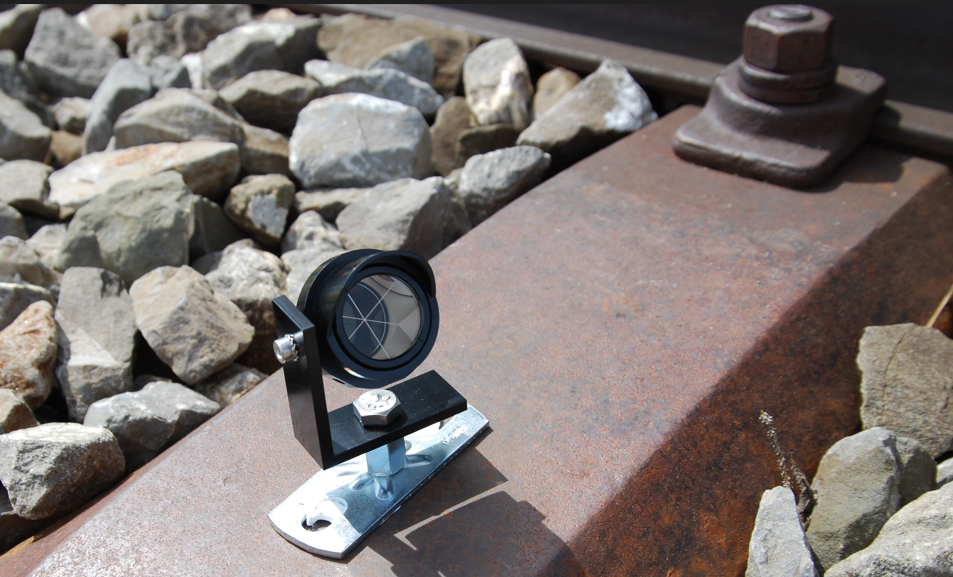
Prisms can also be fastened on the rail itself using the rail clamps. Rail dimensions must be known so that the rail clamp can be installed.
Prism fastened on the rail
General Workflow
Setting up and creating the rail monitoring project in the field and the office consists of following parts:
1. Selecting the Coordinate system valid for the rail monitoring project
2. Setting up the measurement round using the Settop M1/T4D Sever or uploading the *.CSV file with the coordinates of the monitoring prisms
3. Performing the station setup
4. Creating the project
5. Adding the sensors in T4D Web
Advised
a) Creating the users to be informed when unwanted parameter change happens
b) Configuring a general alarm for all the prisms involved in the rail monitoring project
6. Creating the Rail monitoring section - Creating the Rail section
7. General tab - AMTS Rail Monitoring with As-Built
9. Chainages
10. Parameters
11. Recipients
Trimble 4D Control Server
Rail monitoring is part of terrestrial monitoring, which can be described as the monitoring of a structure over time. In this case, the structure is the rails. Trimble recommends using a Settop M1 Total Station Controller to manage and control the total station. The data is then transferred to Trimble 4D Control installed on a local Windows or Azure server. In Trimble 4D Control (T4D), the measurements are checked, corrected, adjusted, and stored in an SQL database and can be displayed on the T4D Web for analysis, reporting, and alarming.
Setting up a project in Trimble 4D Control Server
Coordinate system
The first step when starting the monitoring project in Trimble 4D Control is to select the coordinate system. This can be done by clicking on the File → System properties → Coordinate System. A new window opens, and the Coordinate System and Zone can then be selected from the Coordinate System Group. By clicking on Next, the Geoid model can be selected.
The user has to be familiar with the coordinate system the data is in, and this coordinate system must be selected in T4D. Among other things, it is important to be able to use the map functionality in the Trimble Control Web application.
Automated Monitoring
The Settop M1 controls the total station and measures the defined round. In this case, rail monitoring prisms are being measured. These rounds are then downloaded by the T4D Data Collector module. Another way to define the round measurement is by using the T4D Data Collector module. After the round is completed, the station setup definition must be done. This is being done in the T4D Data Collector module.
It is also possible to import the coordinates of measured points from a CSV file. The CSV file is then imported into the T4D Server, and the station setup is done in the T4D Server. A *.track file, containing all track geometry information, can be imported into T4D Web for further calculations of the rail geometry parameters.
Every following new measurement of the monitoring prisms is then automatically processed in the T4D Server and used in the T4D Web Rail monitoring module to further calculate the rail geometry parameters.
In case two or more total stations are being used for one rail monitoring project, network adjustment must be done, i.e., all of the Data Collectors have to be selected in the same Terrestrial Engine.
Semi-automated
In this combination, the user uses the TA Monitoring app to do the site setup and to measure monitoring prisms in the field and the TA Track Gauge Survey app to measure the track itself. One way to go from here if the user is setting up an automated system is to transfer the site setup definition and the measured round (directly from the app) to Settop M1 to start the fully automated system.
If the user is performing semi-automated monitoring, then the TA Monitoring exported *.tamsetup file can be imported into the Data Collector in the T4D Server, containing the site setup and the coordinates of the monitoring prisms.
Every following new measurement of the monitoring prisms is then exported from the TA Monitoring app and manually imported into the T4D Server.
The *.track file, exported from the Track Gauge Survey app, containing all track geometry parameters, is imported into T4D Web for further calculations of the rail geometry parameters.
Semi-automated monitoring is also possible using manual data entry in the T4D Web application. After creating manual sensors in T4D Web, measurement data can be manually uploaded and automatically applied to the rail section containing those sensors. To learn about this solution, see Trimble 4D Control Web Help Portal.
Other supported file types containing measurement data that can manually be uploaded in T4D Server are Job XML (*.jxl) and GKA files.
Trimble 4D Control Web
Creating the project
To add a new project, click on the green + button in the header row of the Project Listing page. This navigates you to the Add Project page. On the Add Project page, it is possible to:
1. Specify a Project Title (required).
2. Add a Description (optional).
3. Select a Timezone (required).
4. Go to the Unit Preferences tab to configure display units.
Once satisfied with all the values, you can click on the Save button. Alternatively, you can click on the Cancel button.
Note that the newly created Project will automatically be set as the new Current Project. When a new Project is created, the Coordinate System Definition is read from the Trimble 4D Server and applied to the new Project. If the Coordinate System Definition in the Trimble 4D Server is changed after the creation of a Project, then the Project Coordinate System Definition may have to be updated.
Adding sensors into T4D Web
The Target (Displacement) sensor type represents the change in Coordinates of a specific prism over time. Since T4D version 6.4, the new data type Coordinates is available for the sensor type Target (Displacement) and GNSS. For rail monitoring purposes, data type Coordinates and Terrestrial displacements are going to be used.
The fastest way to add multiple sensors in T4D Web is through the Projects window in the Administration tab. To begin this process, click on the Add Multiple Sensors in the Project Manager tab. On the Sensor Type tab, select the Target (Displacement) sensor type. If the Rail monitoring module license is available, the Coordinates as the data type is going to be selected automatically.
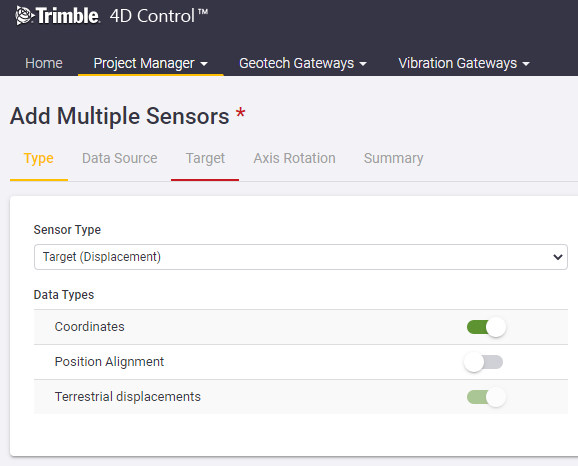
Data types for Target (Displacement) Sensor Type
You can proceed to the next tab by clicking on it or clicking on the Next button.
The drop-down on the Data Source tab will contain a list of all the position modules in the T4D Server. Select the desired one and click on the Next button.
The Target tab consists of a grid or table showing all the targets (or prisms) associated with the selected Data Source. By default, all the targets will be selected, and a default sensor name will be suggested based on the Target Name. You can select or deselect the individual targets that should be imported. You can also edit each sensor name individually or specify a Prefix and/or Suffix to be added to the auto‐generated names. Additionally, you have the option to import historic observation data (if available).
It is advised to use prefixes and meaningful naming for the monitoring prisms (sensors) applicable to the track that is being monitored. This can be very beneficial in the rail switch area, where two or more tracks come together. This early elimination of sensors based on a name prefix and its connection state offers the opportunity to the user to exclude certain sensors from the detection algorithm.
This can be done here in T4D Web while creating the sensors or in the field while measuring.
Importing history data
The Rail module allows the utilization of historical data for parameter calculations. To import historical data, simply activate the Import History button when adding sensors in T4D. After that, during the Rail section creation workflow, ensure that you select the preferred reference point (see figure below for guidance - Geometry Window - AMTS Rail Monitoring with As-Built). This feature proves beneficial when you need to retroactively choose the ideal starting point for monitoring, enabling users to navigate back in time and accurately start monitoring from the desired historical data point.
The Rotation Angle of the targets can be configured on the next tab. Click on the Next button to proceed to the Summary tab.
Review the details on the Summary tab and click on the Save button.
A progress bar will appear at the top of the page. The Target (Displacement) sensors will be created and connected to the selected Data Source. It is important to keep your browser open and to remain on the current page until the process completes. When all the sensors have been created and connected, you will be navigated back to the Sensor Listing page.
Rail Monitoring Module
The Rail Monitoring module can be found under the Monitoring tab in Trimble 4D Control admin web.
Rail Monitoring Module in T4D Web application
Rail section
The Rail section is the representation of the rail monitoring project in the field, containing all of the rail track geometry parameters, which are calculated using the data collected in the field, automatically or manually, with total station or tiltmeters.
Rail section window
The main components of the Rail section are:
-
Rail section Status → fast way to see the status of the rail monitoring section
-
Rail section Name
-
Sensor type → Either Target or Tiltmeter
-
As-built survey → Whether or not an as-built survey was used
-
Cant basis information
-
Chainage range
-
Number of chainages
-
Button to Enable or Disable the Rail section (editing the Rail section is only possible if the Rail section is Disabled)
-
Rail section Status → takes you to the tabular view
-
Charts by Chainage
-
Charts over Time
-
Reports
-
View/Edit Rail section (depending on whether the Rail section is enabled or disabled)
-
Delete Rail section
-
Refresh Rail sections
-
Add new Rail section
Creating the Rail section
Rail section can be created by clicking on the Add new Rail section button in the Rail Monitoring module. There are three ways to create a section: AMTS Rail Monitoring with As-Built, AMTS Rail Monitoring without As-Built, and Rail Monitoring with Tiltmeters. There are five main steps when creating the Rail Monitoring section.
AMTS Rail Monitoring with As-Built
General
This is where the Rail section name, sensor type, use of as-built, height reference, twist output, units for the chainage, rail geometry parameters (Cant, Twist, Horizontal Displacement and Vertical Displacement, Horizontal Versine and Vertical Versine), and Observation age have to be defined. The Sensor Type specifies if targets (prisms) or tiltmeters are used. The As-Built Survey button is where the user decides if the collected as-built survey data is going to be used for the offset and parameter calculation or if there is no as-built survey data available. The as-built data is written in the *.track file. Height Reference specifies if the left or right rail is used as a reference for the height. Twist Output tooltip allows the user to select how the twist will be expressed (see Twist).
Select the desired units and decimals and click on the Next button.
Creating rail section - General tab
Track geometry
The Track Geometry window is where the user has to upload the *.track file. There is an information button that gives a short description of the file. Additionally, cant basis and chainage range information from the file is shown in the window. After uploading, click on the Next button.
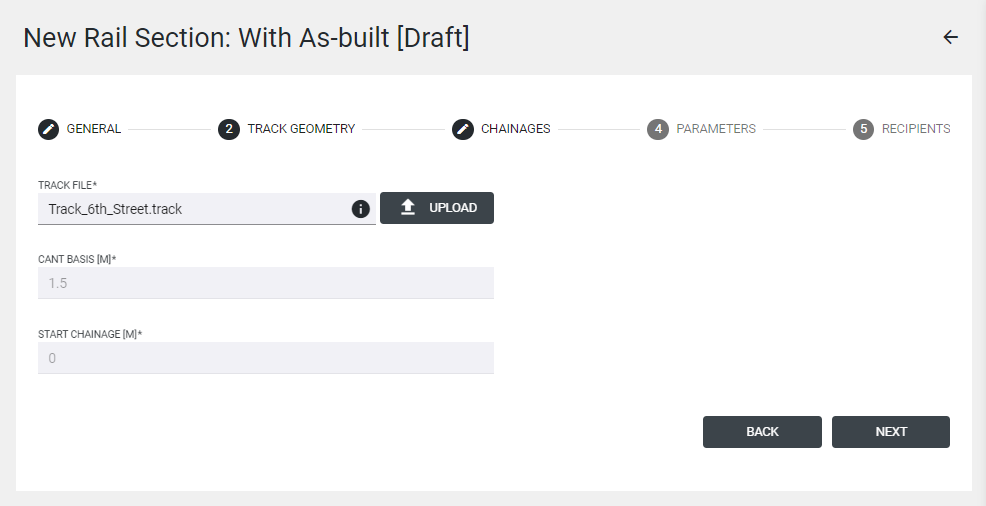
Geometry Window - AMTS Rail Monitoring with As-Built
Chainages
In the next step, the data from the Track file and the sensors added in T4D come together, and T4D shows auto-detected sensor pairs along the Rail section. Based on the chainage information from the track file and the coordinates of the prisms, prism pairs are created. In addition, the user has the possibility to set the Reference Date (defaulted to "Now"), specify an optional Sensor Prefix, and re-run the detection. This is helpful in case there is a measurement round in which not all prisms were measured (e.g. when the train is passing) or there is inconsistency in the available data (e.g., windy weather).
If the chainage is not necessary for the monitoring project, it can be deleted.
It is advised to use prefixes and meaningful naming for the monitoring prisms (sensors) applicable to the monitored track. This can benefit the rail switch area, where two or more tracks come together. This early elimination of sensors based on a name prefix and its connection state allows the user to exclude specific sensors from the detection algorithm.
This can be done in the field while measuring or in T4D Web while creating the sensors.
The values in the Reference Date fields are used to find Reference Coordinates Observations for each sensor during the detection. The optional value entered into the Sensor Prefix can filter specific sensors in or out when detecting sensors associated with the specified railway track.
The figure below shows the sensor pairs detected along the Railway section.
-
The Chainage column shows the chainage value (along the track axis) associated with each sensor pair.
-
The Interval column shows the chainage value increment from the previous station pair to the current pair.
-
The Left Sensor and Right Sensor columns show the prism names of the sensors on the left side and the right side detected at each Chainage.
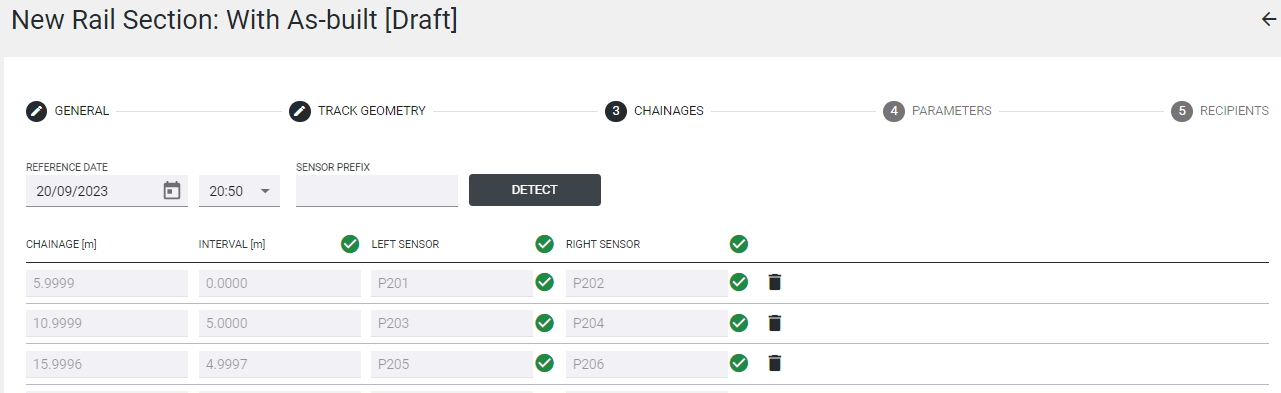
Track Geometry Window - AMTS Rail Monitoring with As-Built
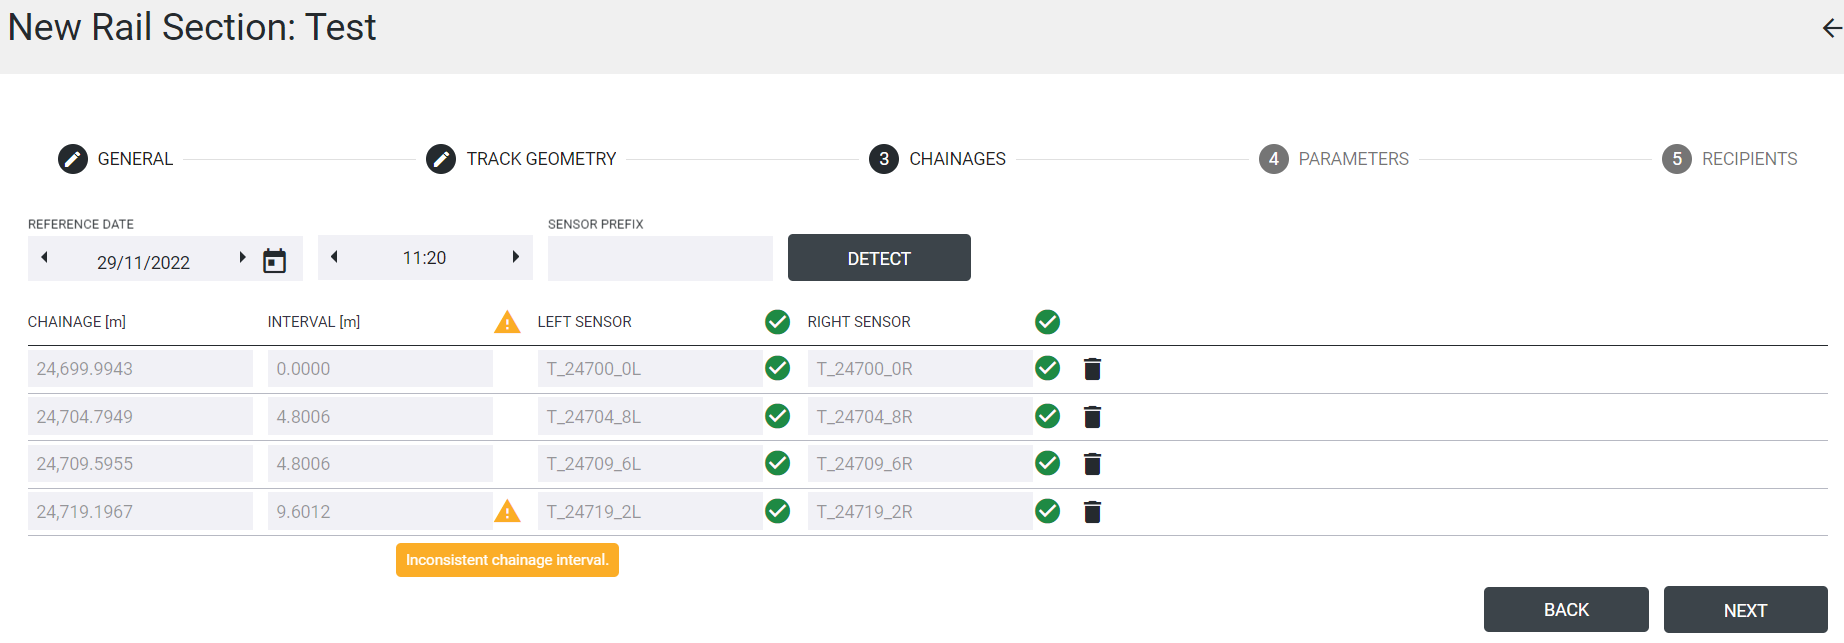
It can happen that not all prisms were measured during one measurement round. If so, the following symbol is shown next to the sensor, ![]() indicating inconsistency.
indicating inconsistency.
Inconsistent Chainage Interval
This warning highlights the scenario where T4D does not have any coordinate observations for one of the prisms installed on the railway line. This warning is intended to inform the user that it is possible that one of the installed prisms has never been measured.
Inconsistent Reference Measurement Date
This warning highlights that not all of the measurements come from the same round measurement. Users must determine whether action should be taken or whether these warnings are explainable and/or acceptable. In other words, the user can accept this inconsistency and continue, or specify a later reference date and press Detect once more.
Creating rail section - Inconsistent Chainage Interval
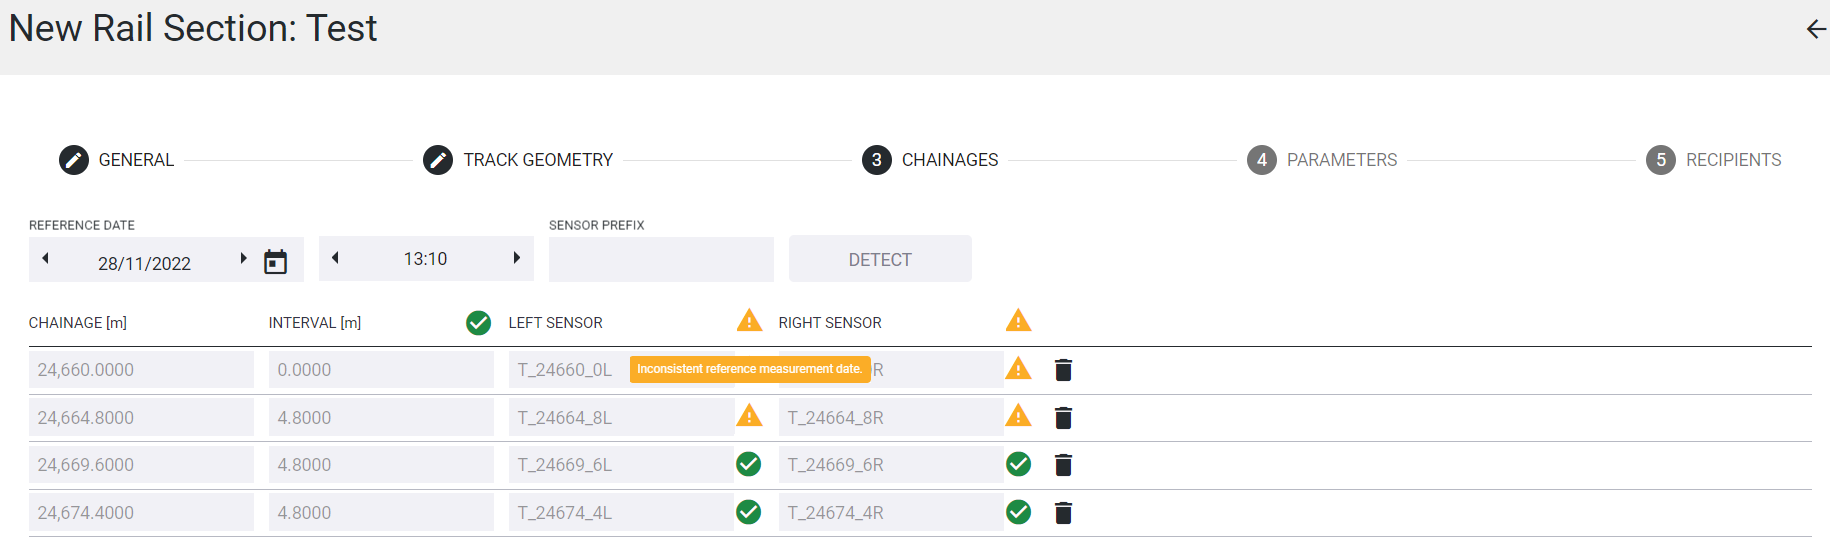
Creating rail section - Inconsistent Reference Measurement Date
The icons![]() /
/ ![]() can be clicked on to view the lateral and height offsets for each sensor, as well as the Reference Observation Date of the Coordinate observation that was used to calculate these offsets.
can be clicked on to view the lateral and height offsets for each sensor, as well as the Reference Observation Date of the Coordinate observation that was used to calculate these offsets.
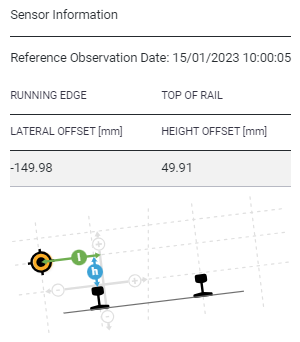
Sensor Information window
Parameters
Parameters tab is where the user chooses which parameter should be monitored (monitor button). After enabling the monitor button, a threshold for attention, warning, and alarm must be entered.
If the parameter should not be monitored and alarmed on, but the user is interested in seeing how the value is changing, the parameter can only be displayed (show button).
As of T4D 6.5 version, the user can calculate and monitor displacements and versines for the track centerline, left rail, or right rail (in version 6.4 only the track centerline was possible).
The information button ![]() next to the parameter name gives us information about the parameter (see figure below).
next to the parameter name gives us information about the parameter (see figure below).
If the thresholds are defined and changed after that, the values in the Rail section status and in the charts will only change after the next measurement round.
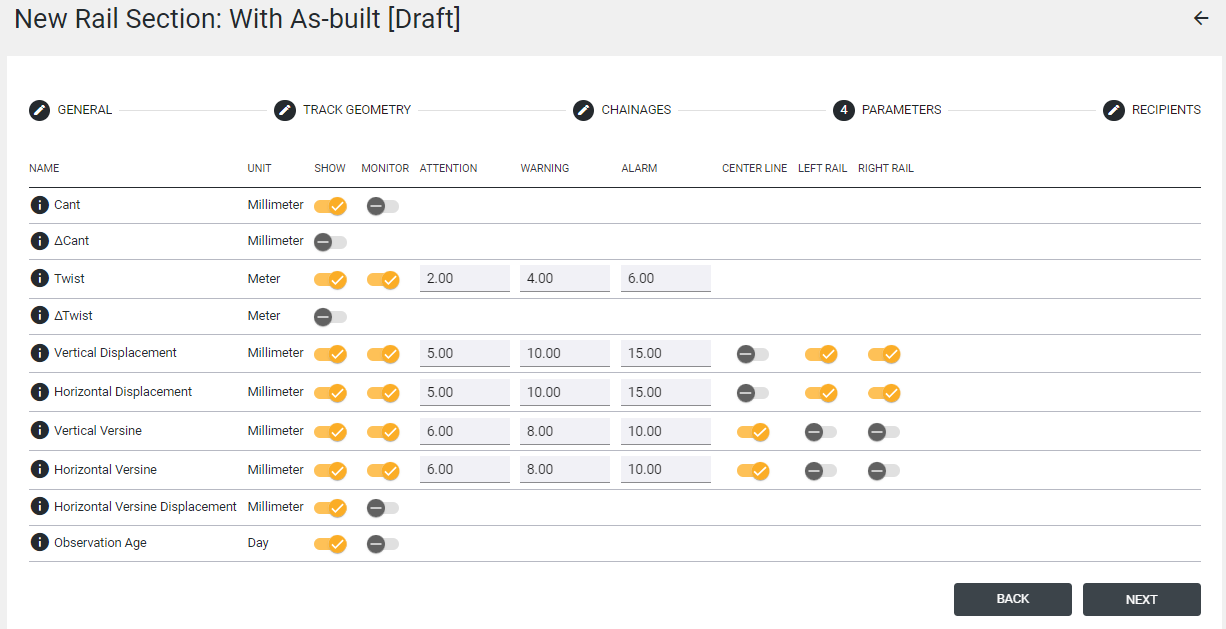
Parameters Window - AMTS Rail Monitoring with As-Built
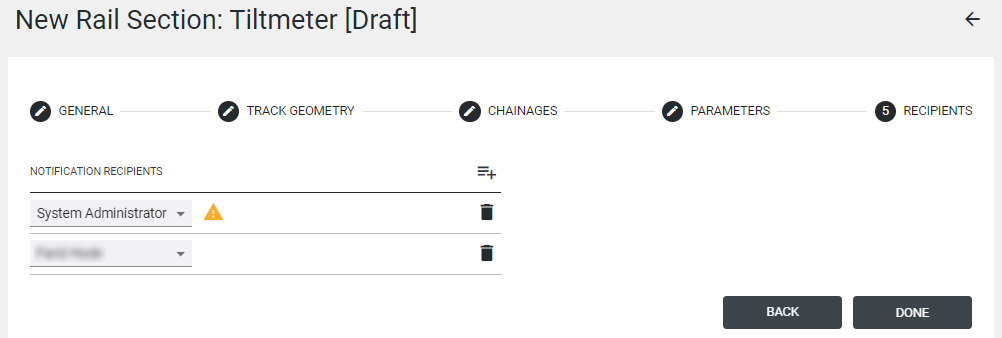
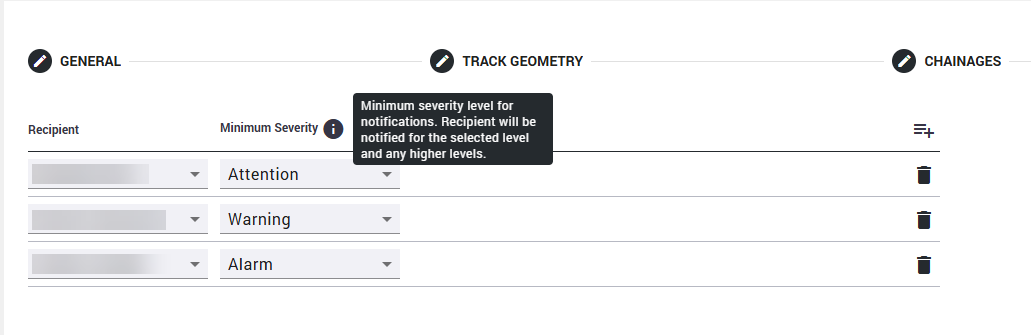
Recipients
To add a recipient, click on![]() in the Recipients tab. These recipients will be notified whenever any threshold of any parameter is reached. How the user will be notified depends on the notifications preference defined as the user account was created (Email/SMS/Web). If the notifications are disabled for the user chosen to be informed, the warning icon is shown, saying that the user has disabled all notifications.
in the Recipients tab. These recipients will be notified whenever any threshold of any parameter is reached. How the user will be notified depends on the notifications preference defined as the user account was created (Email/SMS/Web). If the notifications are disabled for the user chosen to be informed, the warning icon is shown, saying that the user has disabled all notifications.
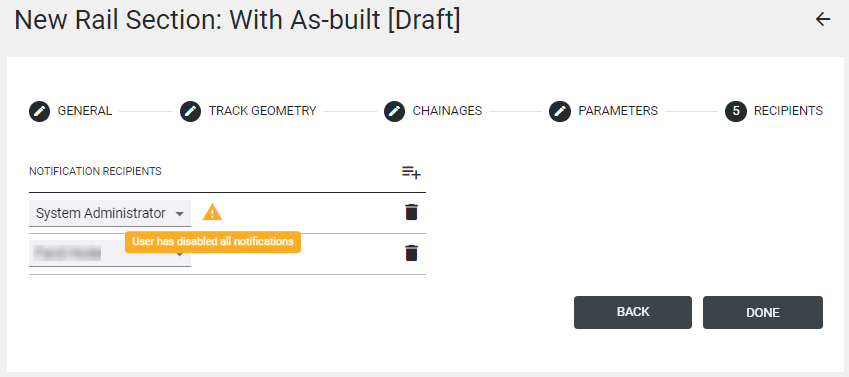
Recipients Window - AMTS Rail Monitoring with As-Built
AMTS Rail Monitoring without As-Built
General
This is where the Rail section name, sensor type, use of as-built, height reference, twist output, units for the chainage, rail geometry parameters (Cant, Twist, Horizontal Displacement and Vertical Displacement, Horizontal Versine and Vertical Versine), and Observation age have to be defined. For AMTS Rail Monitoring without as-built data, the As-Built Survey toggle must be switched off. Define the height reference, twist output, and parameter unit and decimal places. Click on the Next button.
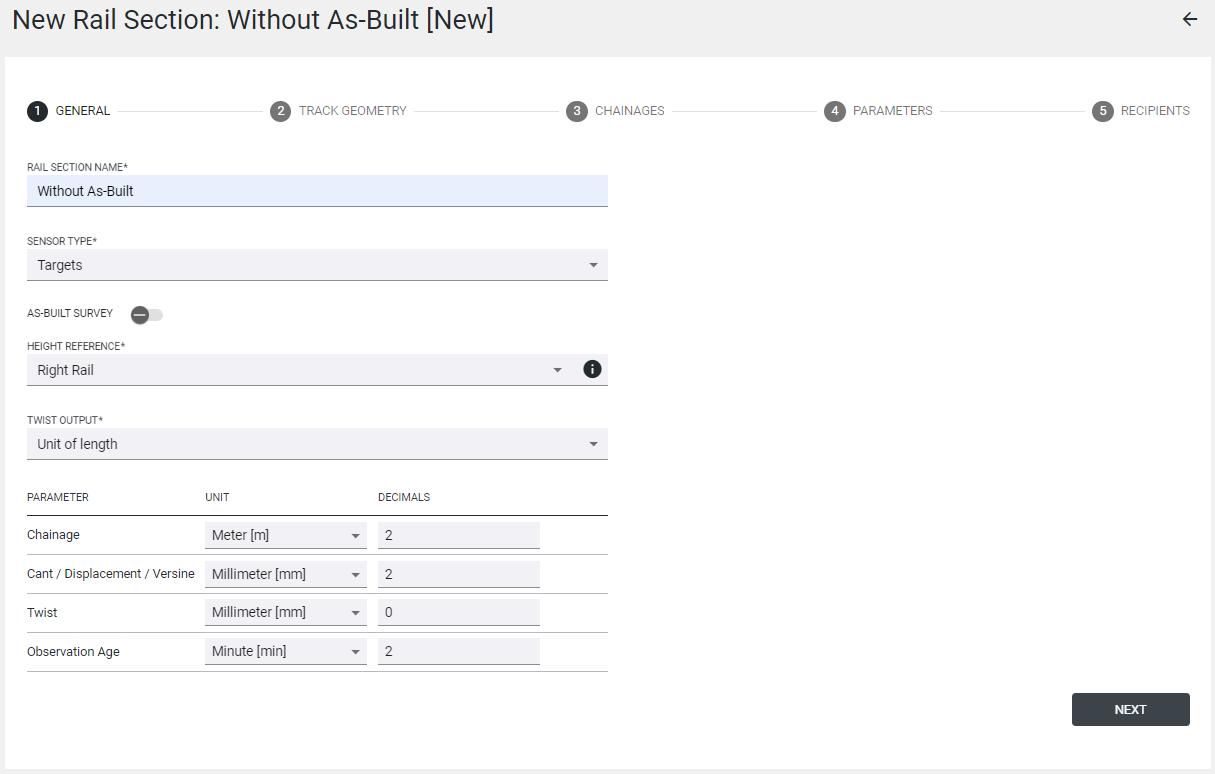
General Tab - AMTS Rail Monitoring without As-Built
Track Geometry
Since no As-Built is being used, certain geometry data that is found in the *.track file has to be manually inputted. In the Track Geometry window, the cant basis needs to be entered, along with start chainage and chainage interval, which is the fixed distance between each prism pair along the track. Optionally, the end chainage can be specified. Finally, the left and right sensors for the first set of prism pairs must also be selected so that T4D has a starting point to sort all the other parameters across the track.
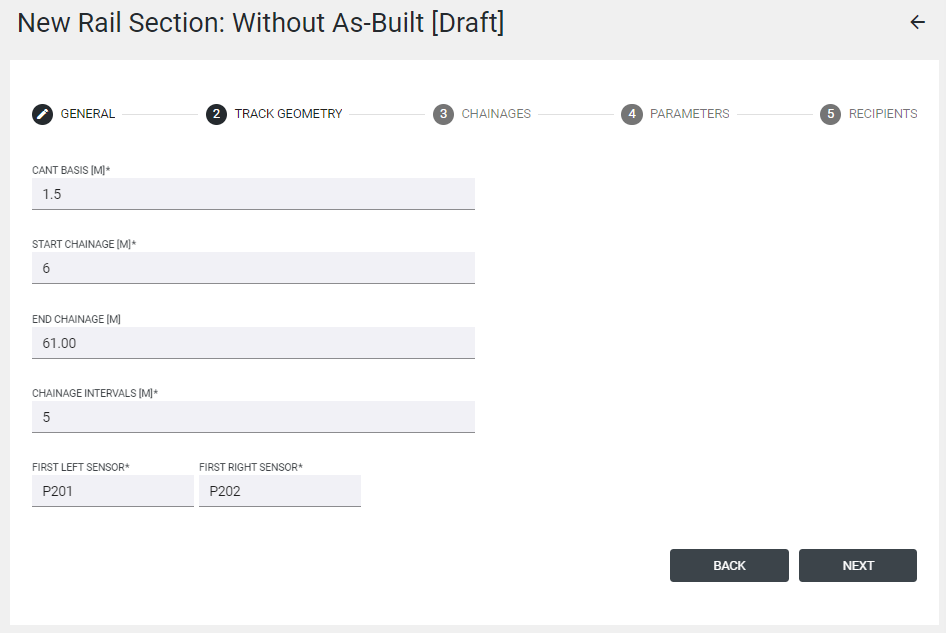
Track Geometry Window - AMTS Rail Monitoring without As-Built
Chainages
In the Chainages window, the remaining prism pairs are then automatically detected with the help of the direction of the first pair defined in the Track Geometry window. T4D Rail will search through the sensors in the current monitoring project, which are linked to the "Coordinates" data type, are in an enabled state and optionally match the specified name prefix. Users can leverage the above to prevent a particular Target from being selected as a candidate. The chainages are also calculated and assigned accordingly. If a pair of targets is incorrectly detected, the targets can be disabled, or the prefix can be manipulated, then click on Detect. For information about chainage inconsistencies and the warning icons, refer to the Chainages subsection of the AMTS Rail Monitoring with As-Built section.
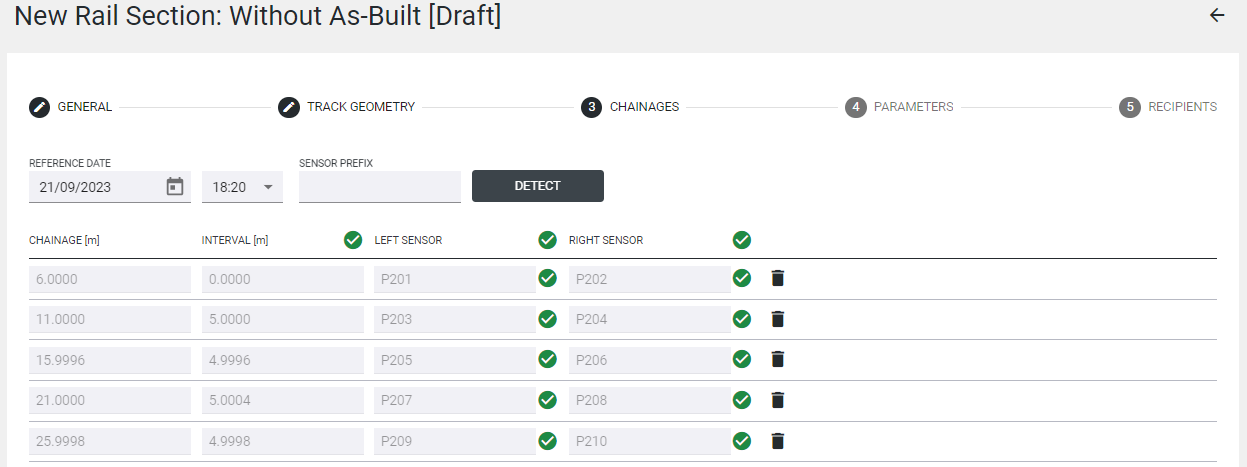
Chainages Window - AMTS Rail Monitoring without As-Built
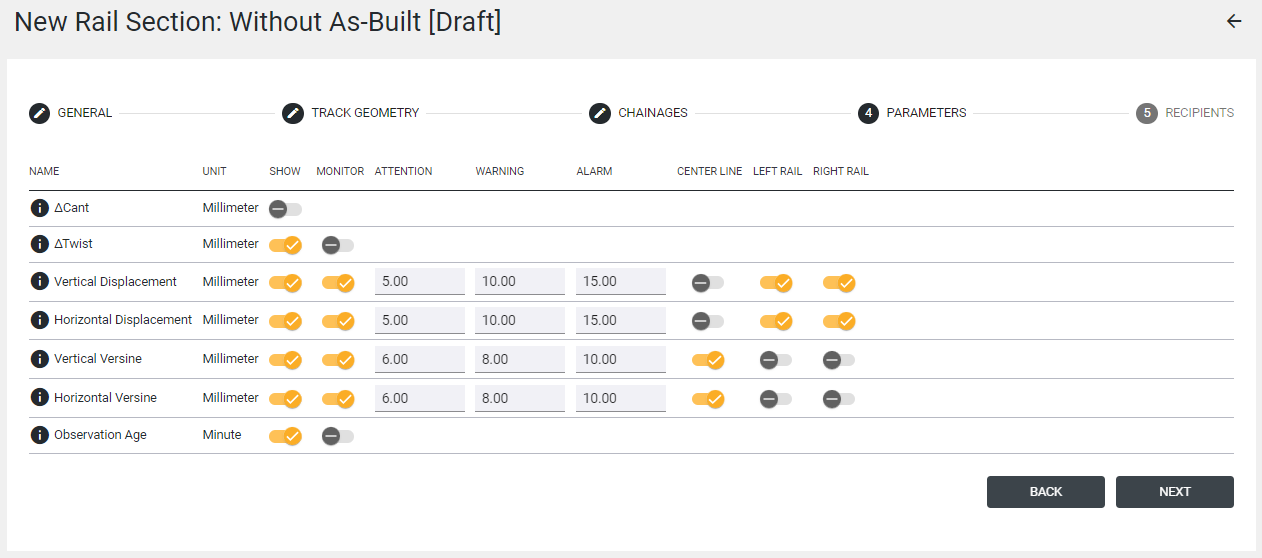
Parameters
The Parameters tab is where the user chooses which parameter should be monitored (monitor button). After enabling the monitor button, a threshold for attention, warning, and alarm must be entered. In the no-as-built workflow, the cant and twist values are only relative. Additionally, the parameters are calculated based on the prisms, not the track itself, as the prism to track offsets are not calculated.
If the parameter should not be monitored and alarmed on, but the user is interested in seeing how the value is changing, the parameter can only be displayed (show button).
The information button ![]() next to the parameter name gives us information about the parameter (see figure below).
next to the parameter name gives us information about the parameter (see figure below).
Parameters Window - AMTS Rail Monitoring without As-Built
Recipients
To add a recipient, click on ![]() in the Recipients tab. These recipients will be notified whenever any threshold of any parameter is reached. How the user will be notified depends on the notifications preference defined as the user account was created (Email/SMS/Web). If the notifications are disabled for the user chosen to be informed, the warning icon is shown, saying that the user has disabled all notifications.
in the Recipients tab. These recipients will be notified whenever any threshold of any parameter is reached. How the user will be notified depends on the notifications preference defined as the user account was created (Email/SMS/Web). If the notifications are disabled for the user chosen to be informed, the warning icon is shown, saying that the user has disabled all notifications.
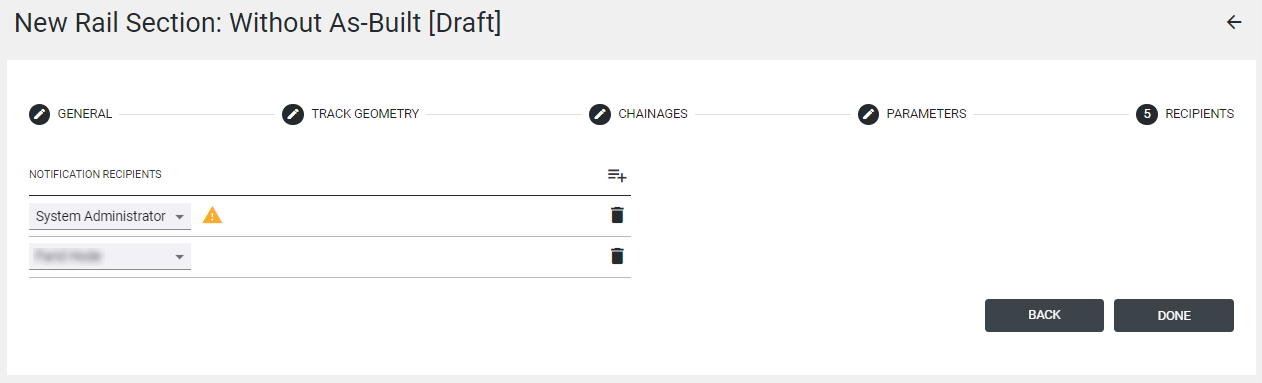
Recipients Window - AMTS Rail Monitoring without As-Built
Rail Monitoring with Tiltmeters
General
This is where the Rail section name, sensor type, twist output, units for the chainage, rail geometry parameters (Cant, Twist) and Observation age have to be defined. For Rail Monitoring with Tiltmeters, the sensor type must be selected as Tiltmeters. The rail section name, twist output, and parameter decimals must be defined. Click on the Next button.
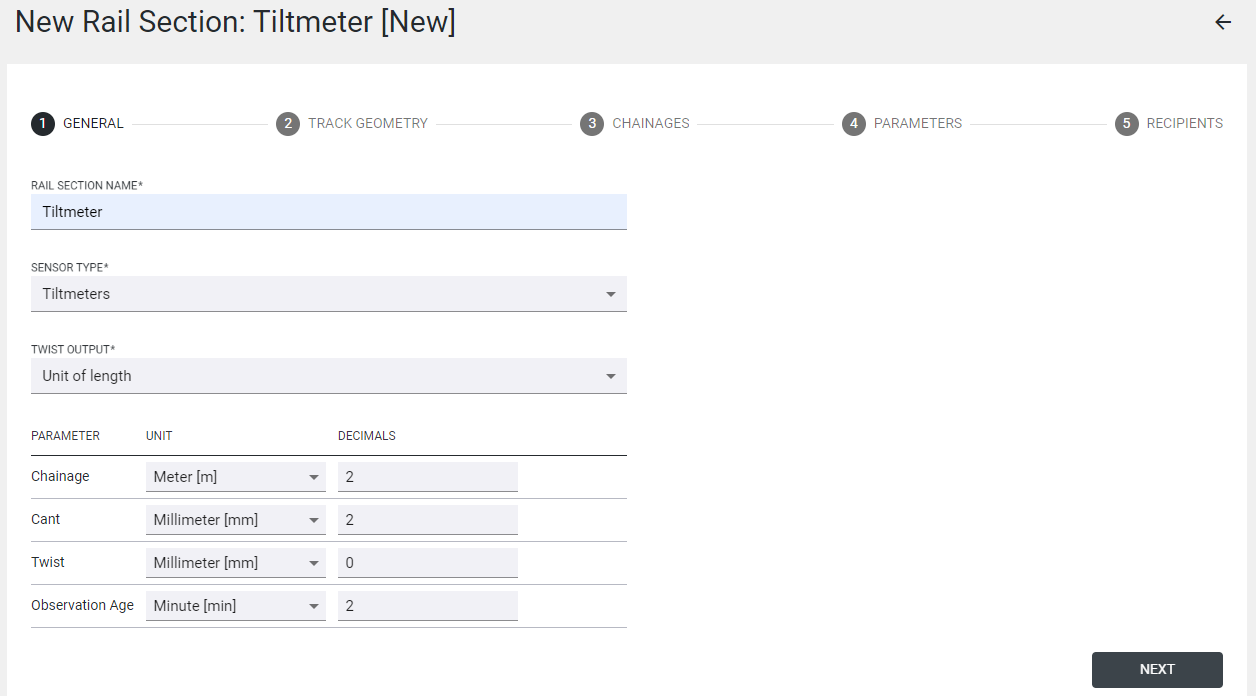
General Window - Rail Monitoring with Tiltmeters
Track Geometry
Similar to AMTS Rail Monitoring without As-built, there is no *.track file to be loaded in the Track Geometry window. The cant basis must be manually set, along with the first and last sensor chainage and the chainage intervals. The first sensor (tiltmeter), the tilt component, which represents the cant plane, must also be selected from the dropdown.
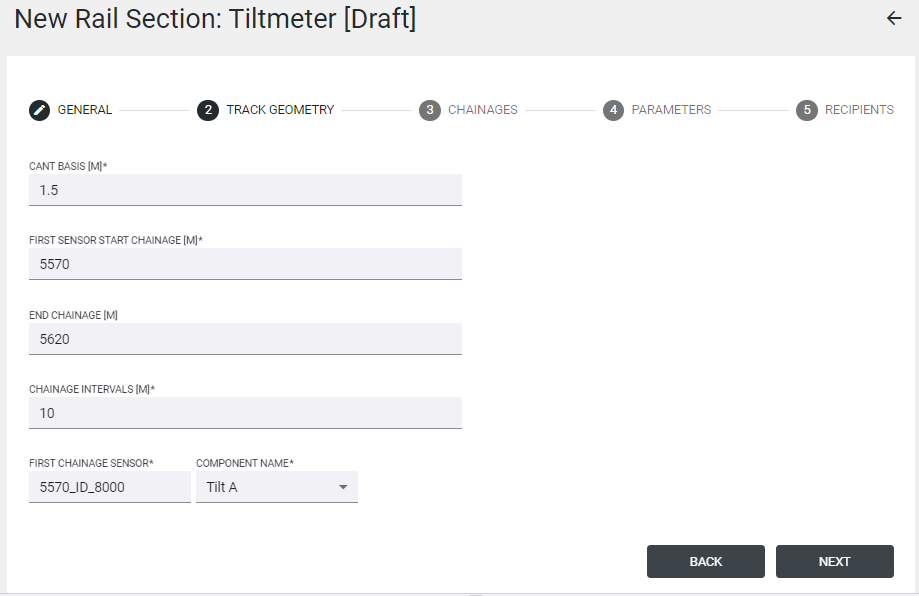
Track Geometry Window - Rail Monitoring with Tiltmeters
Chainages
In the Chainages window, the remaining sensors are assigned chainages based on the chainage interval set in the Track Geometry window. The sensor sequence can also be set to ascending or descending depending on the project. The Detect button will automatically detect the sensor sequence from the sensor names and apply the chainage interval. For information about chainage inconsistencies and the warning icons, refer to the Chainages subsection in the AMTS Rail Monitoring with As-Built section.
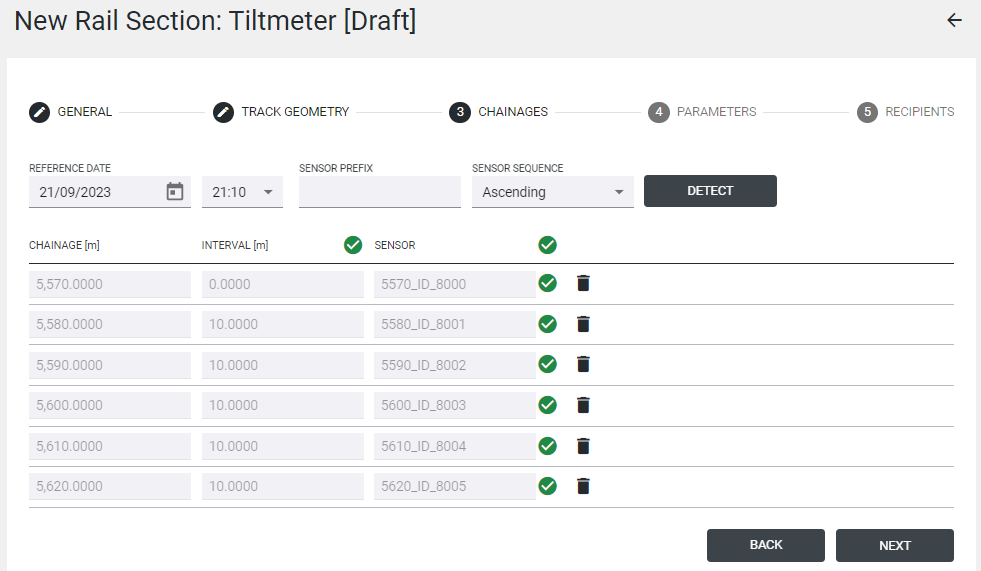
Chainages Window - Rail Monitoring with Tiltmeters
Parameters
The Parameters tab is where the user chooses which parameter should be monitored (monitor button). After enabling the monitor button, a threshold for attention, warning, and alarm must be entered.
When tiltmeters are used for rail monitoring, only ΔCant and ΔTwist can be monitored (next to Observation Age).
If the parameter should not be monitored and alarmed on, but the user is interested in seeing how the value is changing, the parameter can only be displayed (show button).
The information button ![]() next to the parameter name gives us information about the parameter (see figure below).
next to the parameter name gives us information about the parameter (see figure below).
If the thresholds are defined and changed after that, the values in the Rail section status and in the charts will only change after the next measurement round.
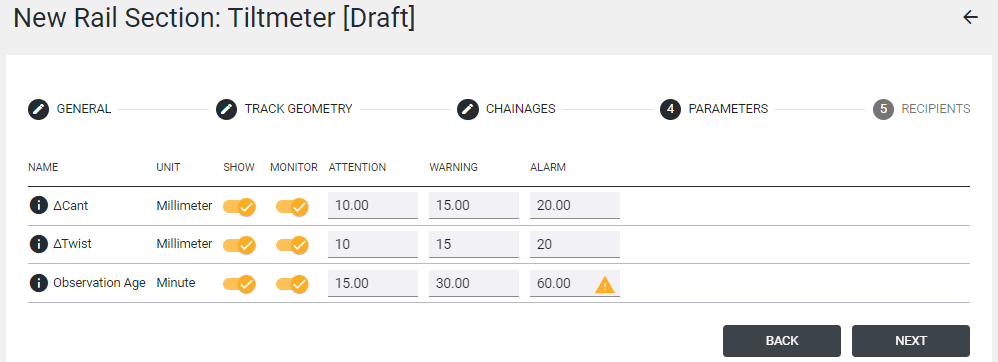
Parameters Window - Rail Monitoring with Tiltmeters
Recipients
To add a recipient, click on ![]() in the Recipients tab. These recipients will be notified whenever any threshold of any parameter is reached. How the user will be notified depends on the notifications preference defined as the user account was created (Email/SMS/Web). If the notifications are disabled for the user chosen to be informed, the warning icon is shown, saying that the user has disabled all notifications.
in the Recipients tab. These recipients will be notified whenever any threshold of any parameter is reached. How the user will be notified depends on the notifications preference defined as the user account was created (Email/SMS/Web). If the notifications are disabled for the user chosen to be informed, the warning icon is shown, saying that the user has disabled all notifications.
Recipients Window - Rail Monitoring with Tiltmeters
Rail section Functionality
Rail section Status
There are two ways to access the rail section status window. On the left-hand side, a colored button immediately gives information on the alarm condition of the rail section at the moment. There are five possible states:
-
Grey empty circle – No measurement data in the Rail section
-
Full grey circle – Rail section is disabled
-
Green – OK
-
Blue – Attention
-
Yellow – Warning
-
Red – Alarm
By clicking on the Status button, the rail monitoring status window opens, giving the user the overview of the last available values, colored based on the defined threshold. Only the selected parameters that are being monitored are shown.
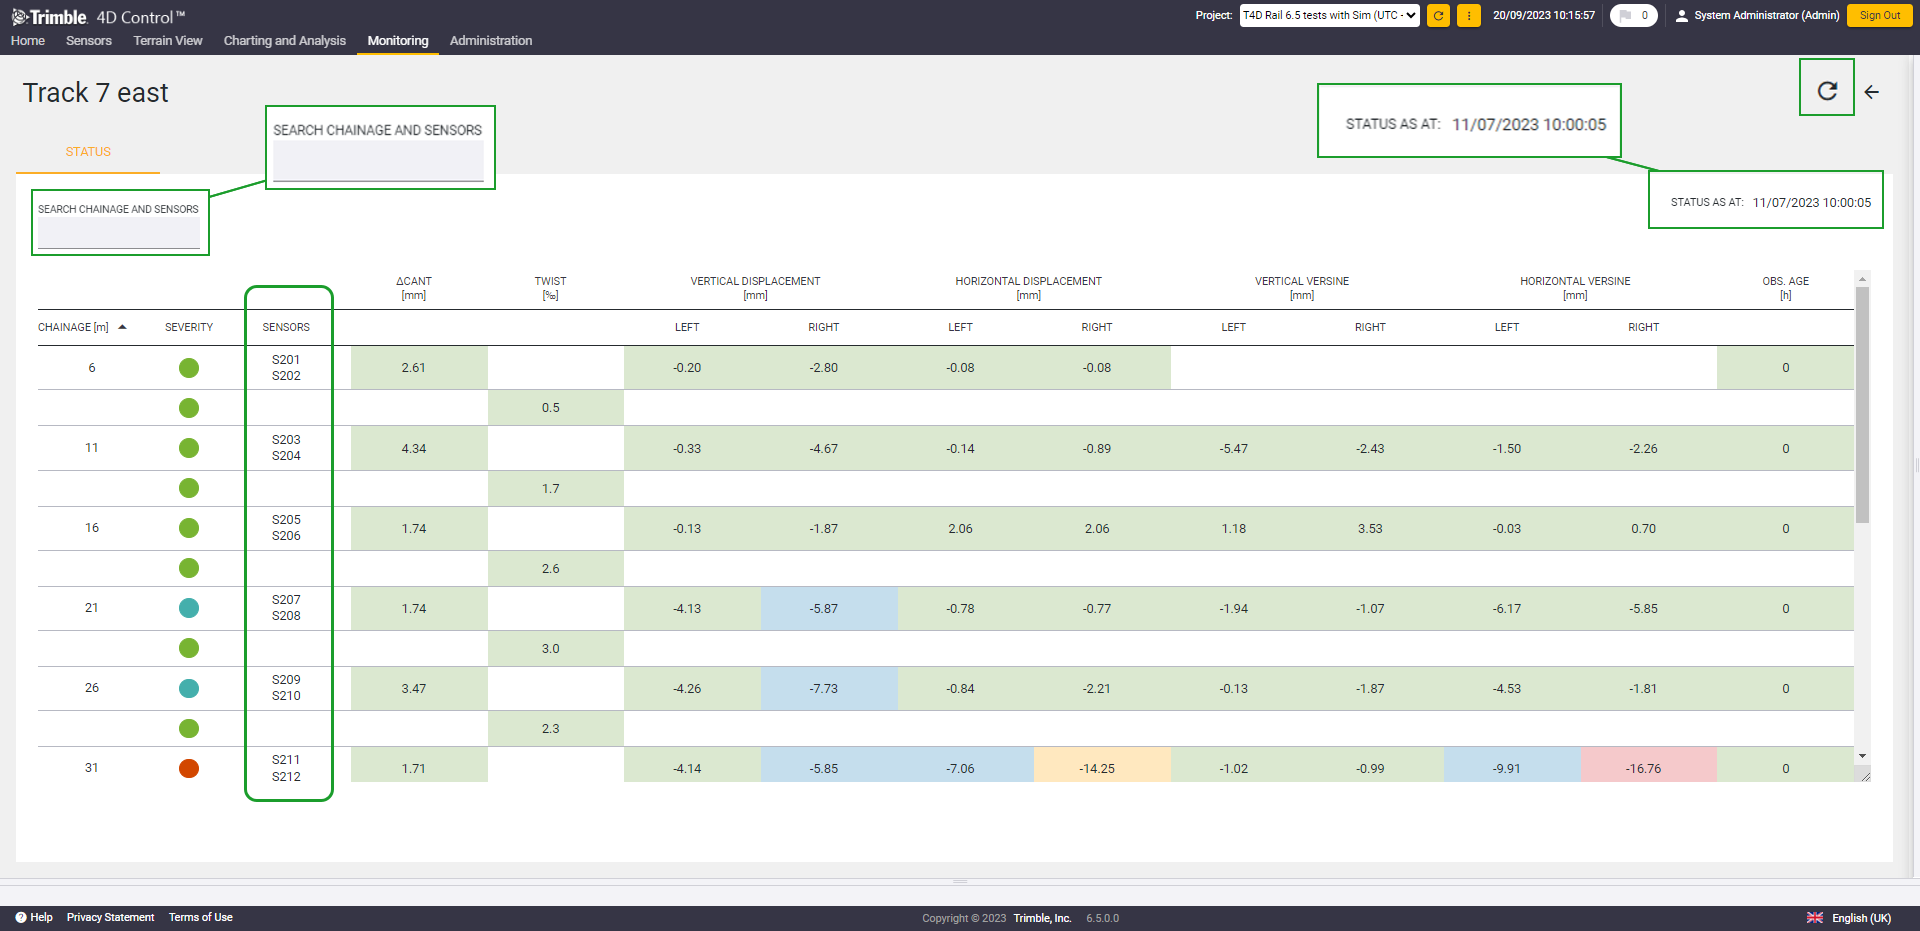
Rail section Status window
Charts by chainage
Charts by chainage help to signal which sections of the track are concerning. You can access Charts by chainage by clicking on the icon. In the component selector, it is possible to choose the parameter which should be visualized. The chainage information is shown on the x-axis. When first opening the chart, the whole chainage range is displayed. With the left mouse click, the area of interest can be selected and zoomed in. Zoom can then be reset with the ![]() button. The Y-axis is where the selected parameter is represented.
button. The Y-axis is where the selected parameter is represented.
At the bottom of the window, there is a Date line containing all of the measured epochs. These can be pinned for analysis purposes, and up to 10 epochs can be pinned. With the left mouse click, the area of interest can be selected and zoomed in. Zoom can then be reset with the ![]() button. The selected epochs are shown above the Date line. These can be deselected by clicking on them.
button. The selected epochs are shown above the Date line. These can be deselected by clicking on them.
If the parameter is being monitored, the defined thresholds are shown on the chart. These can be hidden by clicking on ![]() and deselecting the box Show thresholds.
and deselecting the box Show thresholds.
Since T4D v6.5 charts have multi-series capabilities to plot all monitored rails, right, left, and center. This new visualization capability empowers the user to make well-informed decisions based on that visualized data.
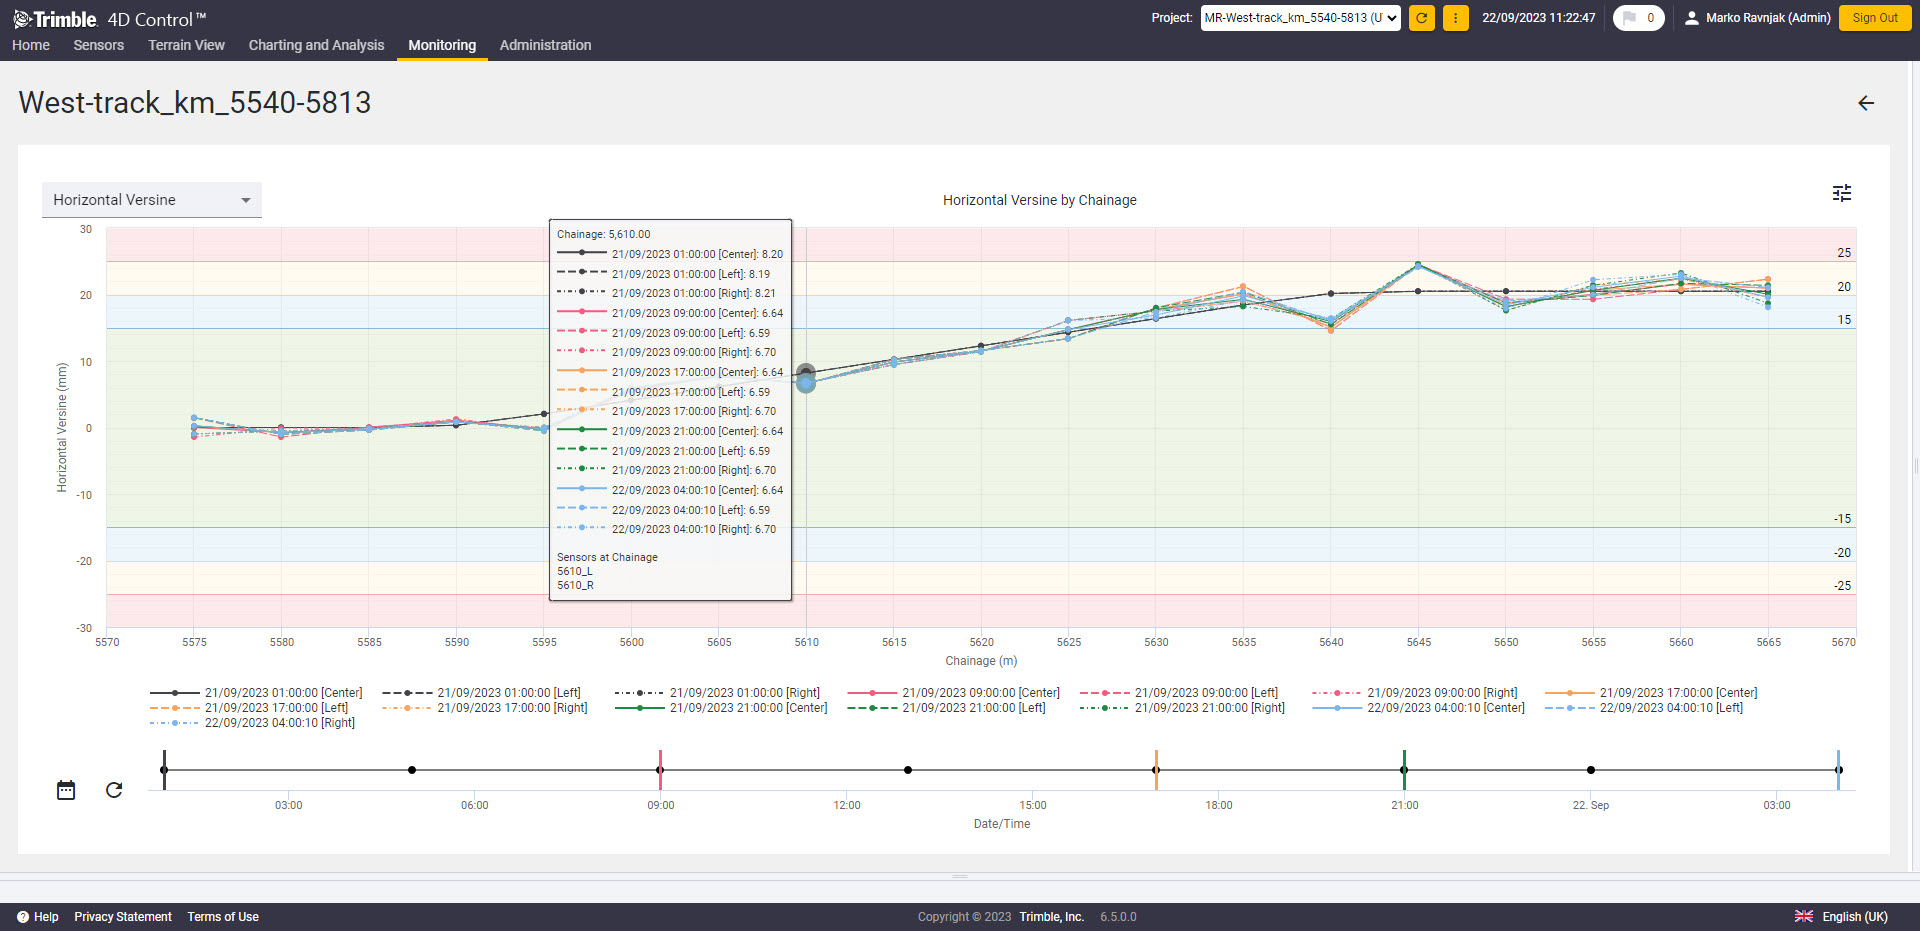
Charts by chainage
Charts over time
Charts over time help to quickly notice at which points in time unwanted movement began. You can access Charts over time by clicking on the ![]() icon. In the component selector, it is possible to choose the epoch which should be visualized. The epochs are shown on the x-axis. When first opening the chart, the last week is shown. With the left mouse click, the area of interest can be selected and zoomed in. Zoom can then be reset with the
icon. In the component selector, it is possible to choose the epoch which should be visualized. The epochs are shown on the x-axis. When first opening the chart, the last week is shown. With the left mouse click, the area of interest can be selected and zoomed in. Zoom can then be reset with the ![]() button. The Y-axis is where the selected parameter is represented.
button. The Y-axis is where the selected parameter is represented.
On the bottom of the window, there is a Chainage line containing all of the measured chainages. These can be pinned for analysis purposes, and up to ten chainages can be pinned. With the left mouse click, the area of interest can be selected and zoomed in. Zoom can then be reset with the ![]() button. The selected chainages are shown above the chainage line. These can be deselected by clicking on them.
button. The selected chainages are shown above the chainage line. These can be deselected by clicking on them.
If the parameter is being monitored, the defined thresholds are shown on the chart. These can be hidden by clicking on ![]() and deselecting the box Show thresholds.
and deselecting the box Show thresholds.
Since T4D v6.5 charts have multi-series capabilities to plot all monitored rails, right, left, and center. This new visualization capability empowers the user to make well-informed decisions based on that visualized data.
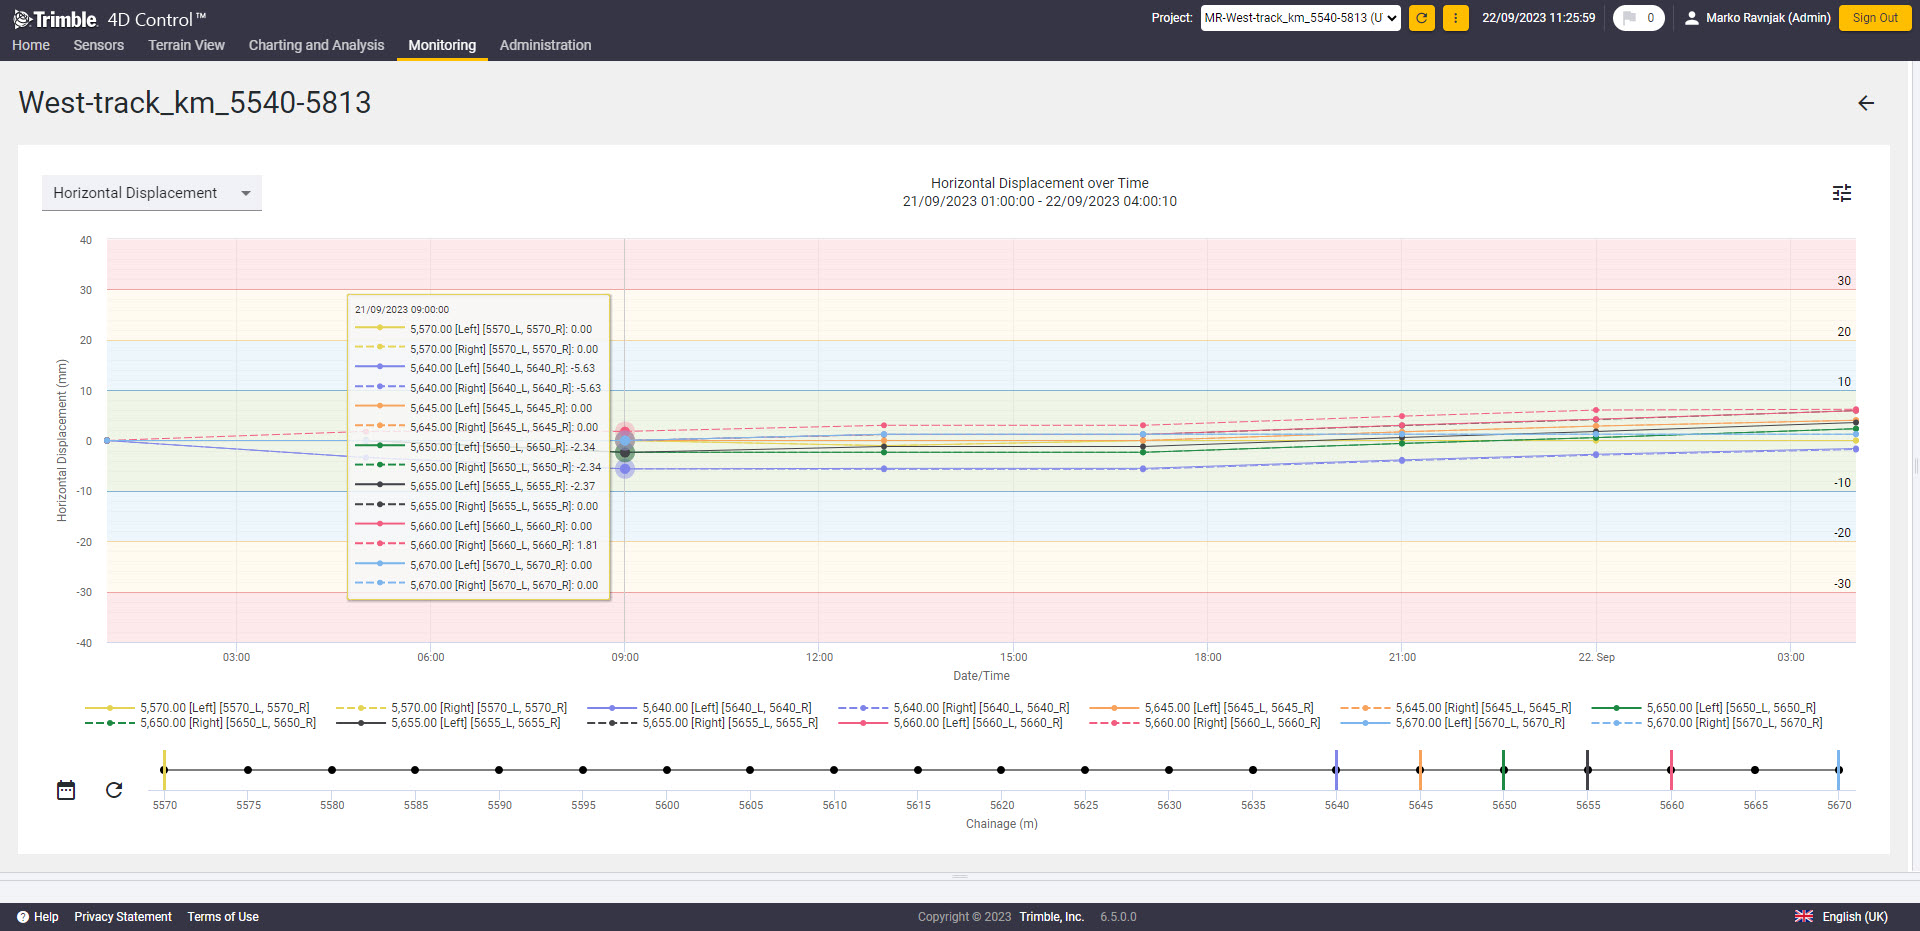
Charts over time
Export
In the Report tab ![]() , it is possible to download the XLSX file containing all of the parameters and their calculations. After selecting the Date range
, it is possible to download the XLSX file containing all of the parameters and their calculations. After selecting the Date range ![]() , the file can be downloaded by clicking on the Download Report button
, the file can be downloaded by clicking on the Download Report button ![]() .
.
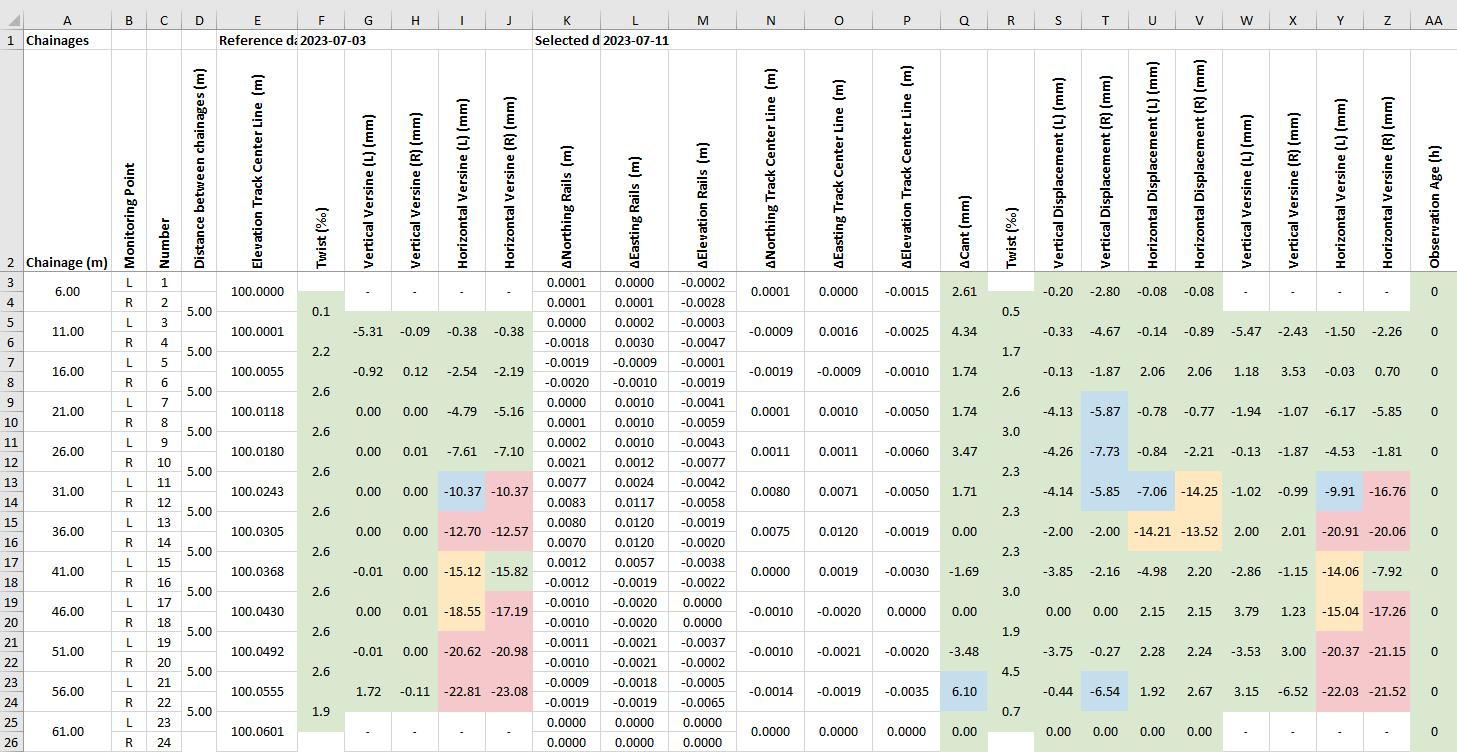
The XLSX file contains information about defined thresholds, a comparison between the reference data values and current data values, and all of the values from every measured epoch of every selected parameter.
There is also an option to download a Detailed Report, which will also include the coordinate deltas from both the left and right rails, along with the centerline. It also provides comprehensive coordinate information, including prism coordinates and prism offsets, for both rails and the track centerline for every measured epoch at each chainage.
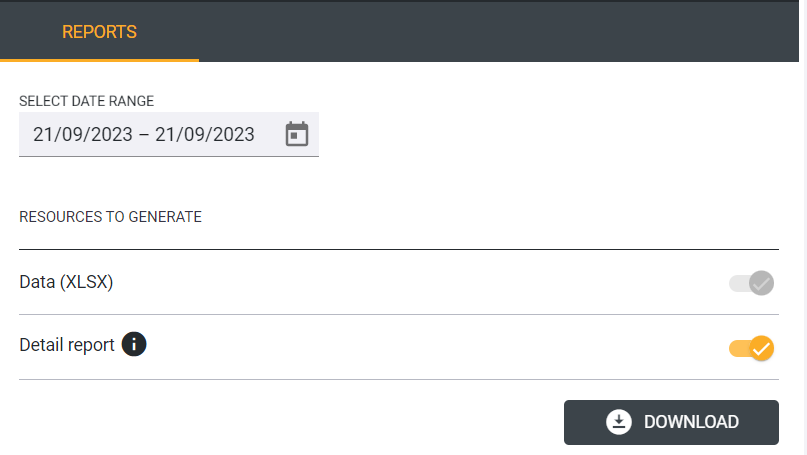
Reports tab with Detailed report enabled
Detailed Report
Alarming
With version 6.5.2, the Rail module has been enhanced to categorize notifications, emails, and SMS messages according to priority levels. The organization follows a hierarchy, beginning with Rail Section Status, followed by an update on the specific Chainage, and concluding with a specific parameter that has changed. This refined system ensures that users are notified only about the most critical change.
One of three distinct types of notifications is possible, based on the level affected:
-
Rail Section Status changed from X to Y.
-
Rail Section Status remains in status X. Change at chainage () m affected Chainage Status update from X to Y.
-
Rail Section Status remains in status X. At chainage () m, parameter value XY affected Parameter Status update from X to Y.
A number of recipients can be associated with each alarm definition. These recipients will be notified whenever the status of a section, chainage or parameter has changed. The users and the notifications preferences have to be defined in the Account Settings in T4D Web, and the users can then be selected in the rail module.
Alarming - Hierarchical Alarm Notifications in T4D Rail
With version 6.6.6 the Recipients section now supports tiered notification delivery based on defined threshold levels (Attention, Warning, and Alarm). This level-dependent approach ensures the appropriate stakeholders are informed as conditions escalate:
-
Attention: Sends notifications only to designated Attention recipients.
-
Warning: Sends notification to both Warning and Attention recipients.
-
Alarm: Sends notifications to all recipients across the Alarm, Warning, and Attention levels.
This structured hierarchy improves communication efficiency and prioritizes alerts according to severity.
Selecting recipients in T4D Rail based on severity
It is advised to configure a general alarm for all of the prisms in a project and to enable the No Data Alarm. For this, a meaningful 'No data time window' should be defined, and a meaningful overall threshold, e.g., ∆d2D and ∆dH (or ∆d3D only).
Ensure that the No Data alarm is enabled on at least one of the conditions associated with the alarm.
Sensor replacement
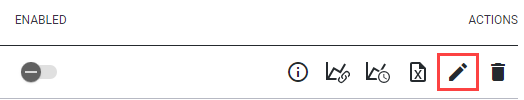
For the as-built workflow, if the sensor was physically destroyed (and replaced in the field) or its position was changed, it is possible to recalculate the offsets between the prism and the top of the rail head. Additionally, if there was a change in the geometry, the track has to be surveyed again. To be able to do so, the Rail section has to be disabled. When disabled, the View button transforms into the Edit button (see figures below).
Rail section information can only be viewed when enabled
Rail section information can be edited when it is disabled
Prism replacement workflow is only advisable if the rail track geometry in the Rail section has not been deformed since the as-built survey used to configure the railway section was performed.
In this case, a new as-built survey and the creation of a new rail section are necessary.
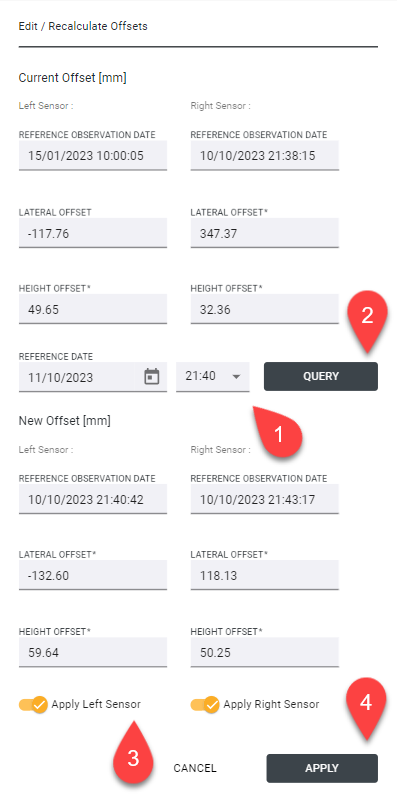
To update the sensor, click on Edit and then select the Chainages tab in the Rail section window. Click on the Edit sensor icon ![]() . The window Edit / Recalculate Offsets opens. The current offsets of the chosen sensor are displayed. The Reference date must be selected (1), and then it can be clicked on Query (2). The new reference date must be set to a date and time after the physical prism was replaced (or moved). The new offsets are displayed. The offsets apply from the moment when the change is applied. It is possible to apply the offsets for the Left Sensor and the Right sensor (3), and this must be confirmed with Apply (4). After applying the offsets, the icon
. The window Edit / Recalculate Offsets opens. The current offsets of the chosen sensor are displayed. The Reference date must be selected (1), and then it can be clicked on Query (2). The new reference date must be set to a date and time after the physical prism was replaced (or moved). The new offsets are displayed. The offsets apply from the moment when the change is applied. It is possible to apply the offsets for the Left Sensor and the Right sensor (3), and this must be confirmed with Apply (4). After applying the offsets, the icon ![]() is updated to show that there is an inconsistency between reference measurement dates.
is updated to show that there is an inconsistency between reference measurement dates.
When the sensor is physically replaced in the field, the first measurement of the new prism position has to be finished for the offsets to be calculated. After this is done, the new offsets can be applied to the new measurements.
Recalculating the offsets
Delete
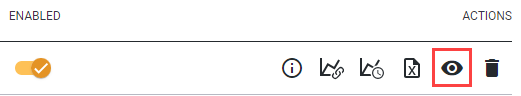
After the rail monitoring project is finished, the rail monitoring section can be deleted by clicking on the delete button ![]() in the rail monitoring section window.
in the rail monitoring section window.
Product versions and features
|
Rev. Nr. |
Date |
Last changes |
User |
|
1.1 |
01.12.2022 |
First version User Guide for the Trimble 4D Control Version 6.4 |
MR |
|
1.2 |
01.12.2023 |
Updated version User Guide for the Trimble 4D Control Version 6.5.2 |
FH |
|
1.3 |
21.04.2026 |
Updated version User Guide for the Trimble 4D Control Version 6.6.6 |
MG |
