Release notes 6.6
Introduction
This section summarizes information on new features, the latest product information, and installation and upgrade procedures for Trimble® 4D Control™ version 6.6.
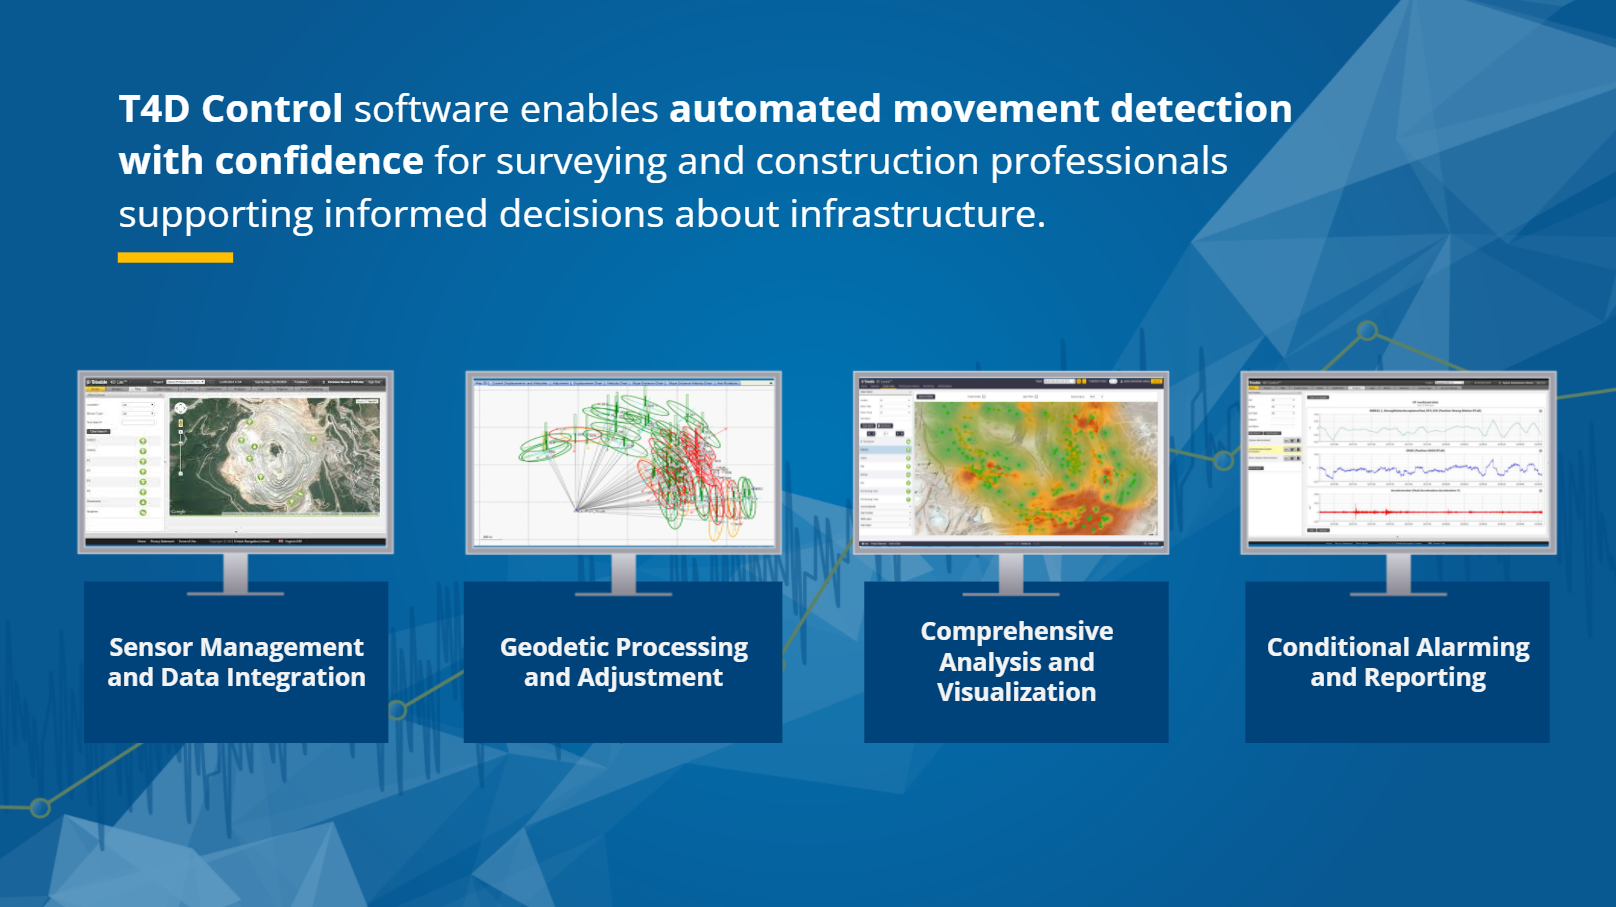
Trimble 4D Control (T4D) enables automated movement detection with confidence for surveying and construction professionals supporting informed decisions about infrastructure. T4D provides benefits in four core areas:
-
Sensor management and data integration, providing support for GNSS, total station, geotechnical, vibration, and environmental sensors.
-
Geodetic processing and adjustment to deliver the most accurate and reliable information from the combination of sensors through network adjustment and integrated processing engines.
-
Analysis and visualization through a set of comprehensive visualization, charting, and analysis tools providing real-time updates.
-
Alarming and reporting leveraging conditional and project-specific alarming and defined user roles, providing up-to-date notification to key stakeholders.
For further support information, please visit the Product Information webpage.
New features in T4D v6.6 enhancing user experience and improving data insights
Introducing 3D Viewer offering a new view angle to data monitoring
One of the primary objectives of any monitoring system is to understand movements and respond promptly when they exceed limits. T4D offers various ways to present movement data to stakeholders, including tabular views, different types of charts, maps, and more. In this release, T4D introduces an innovative 3D Viewer functionality. This feature allows users to visualize sensors and their displacements in 3D space, either directly on a 3D model represented as a TrimBIM file, or independently if a model is not available. This provides a more intuitive and comprehensive understanding of movement data.
The 3D Viewer offers a variety of powerful features tailored to provide better insights into movement and displacement. Key functionality includes:
-
Movement analysis with or without a model - link sensors to a model for a comprehensive visualization of sensor distribution and movement from various angles in the 3D space. Alternatively, if a model is unavailable, visualize sensors and vector displacements independently as a stand-alone representation in the 3D space.
-
Charting in the 3D Viewer - directly view sensor movement history as charts within the 3D Viewer, providing valuable insights into patterns and trends over time.
-
Screenshot capture - easily take screenshots of specific views in the 3D Viewer. This feature is perfect for documentation and sharing critical perspectives with stakeholders.
-
Adjustable displacement vector scaling - fine-tune the representation of movement in 3D space by customizing displacement vector scaling, ensuring clarity during movement analysis.
About TrimBIM File Format
TrimBIM is a file format developed by Trimble to optimize upload/download times and facilitate seamless model interaction. TrimBIM (*.trb) efficiently stores 3D BIM/Civil geometry and attributes, providing fast in-memory random access and offering a smarter way to work with model data. It significantly accelerates model-based processes and enables the same model to be used across different Trimble applications. With the T4D 6.6 release, the TrimBIM file is now also supported in T4D for visualizing sensors and displacements in 3D space. To ensure accurate sensor placement on the model, the TrimBIM file must be in the same coordinate system (public or local) as the T4D project.
Creating a TrimBIM File
Trimble develops, implements, and maintains the TrimBIM file format, utilized across various Trimble software applications such as Trimble Connect, Trimble Business Center (TBC), Quadri, Tekla, and Trimble Access. To learn how to create a TrimBIM file from Trimble Connect visit the 3D Viewer section in the T4D Web Help portal.
Visualizing a Model in 3D Viewer
To visualize sensors and displacements on a 3D model, open the 3D Viewer in T4D Web from the Terrain View menu. Here, previously analyzed models are listed and can be selected and revisited. If an update to an existing model in a 3D space is necessary, use the edit button to replace the model or change the name.
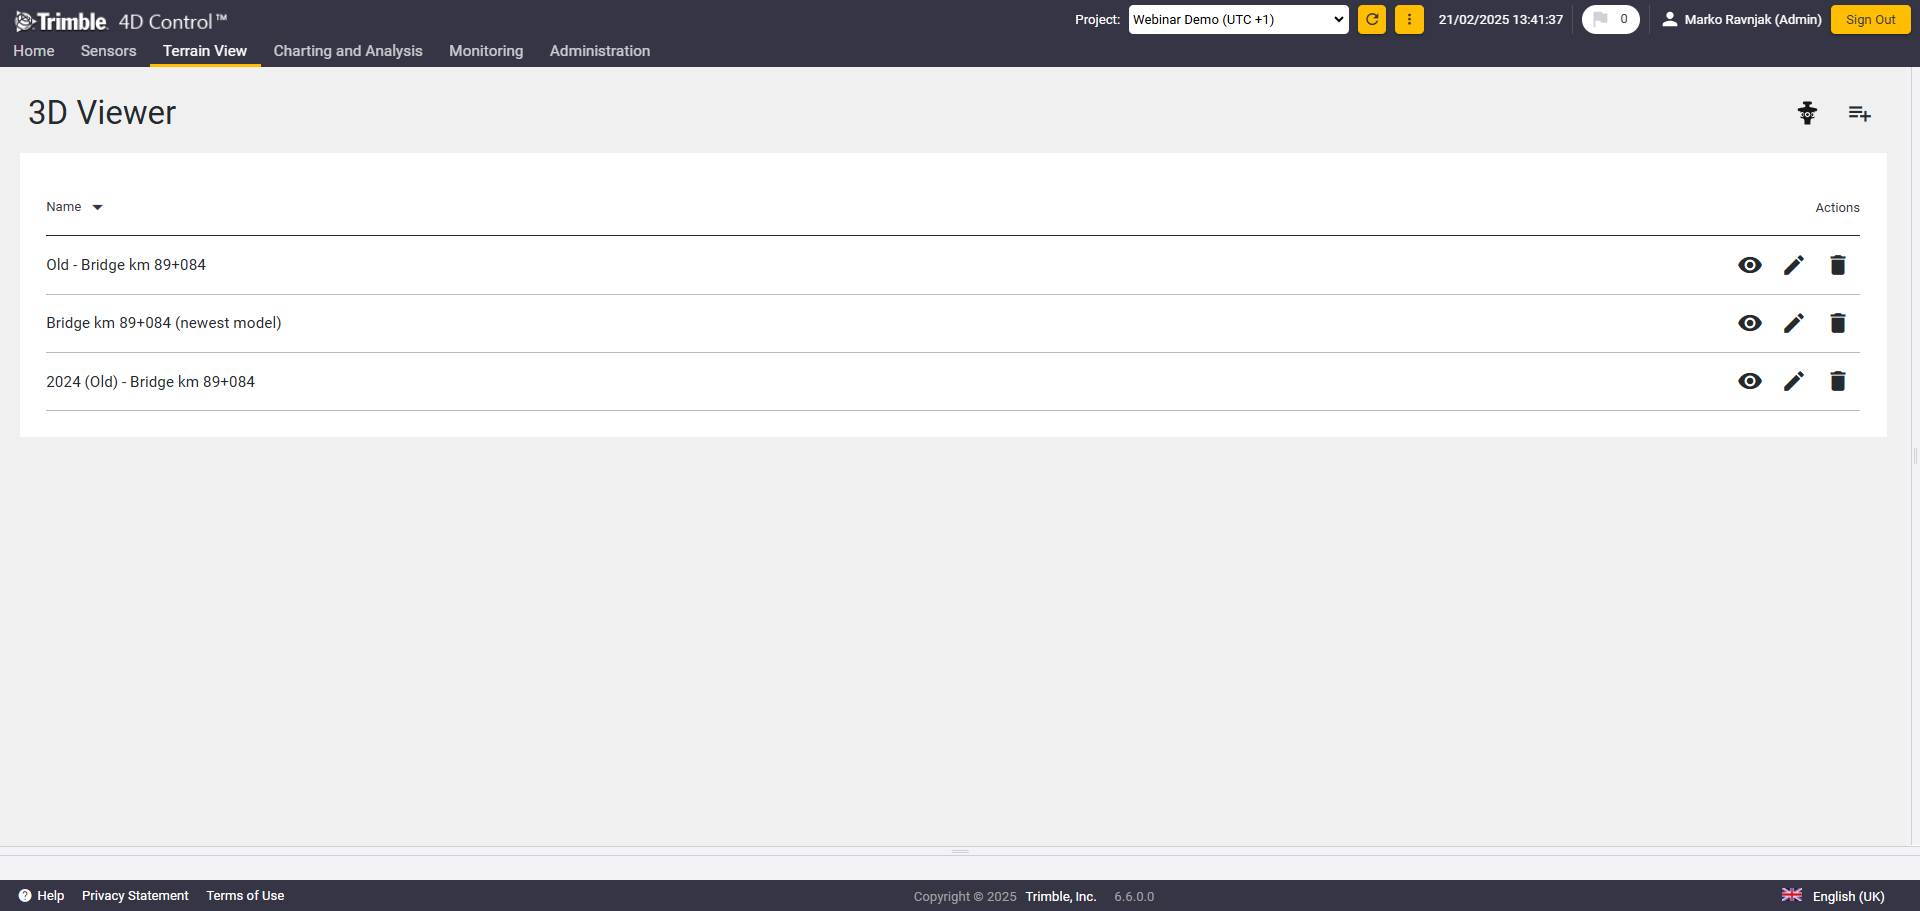
3D Viewer landing page
Users can also visualize sensors and vector displacements without the model, displaying them in an empty 3D space to help visualize the movement in 3D space.
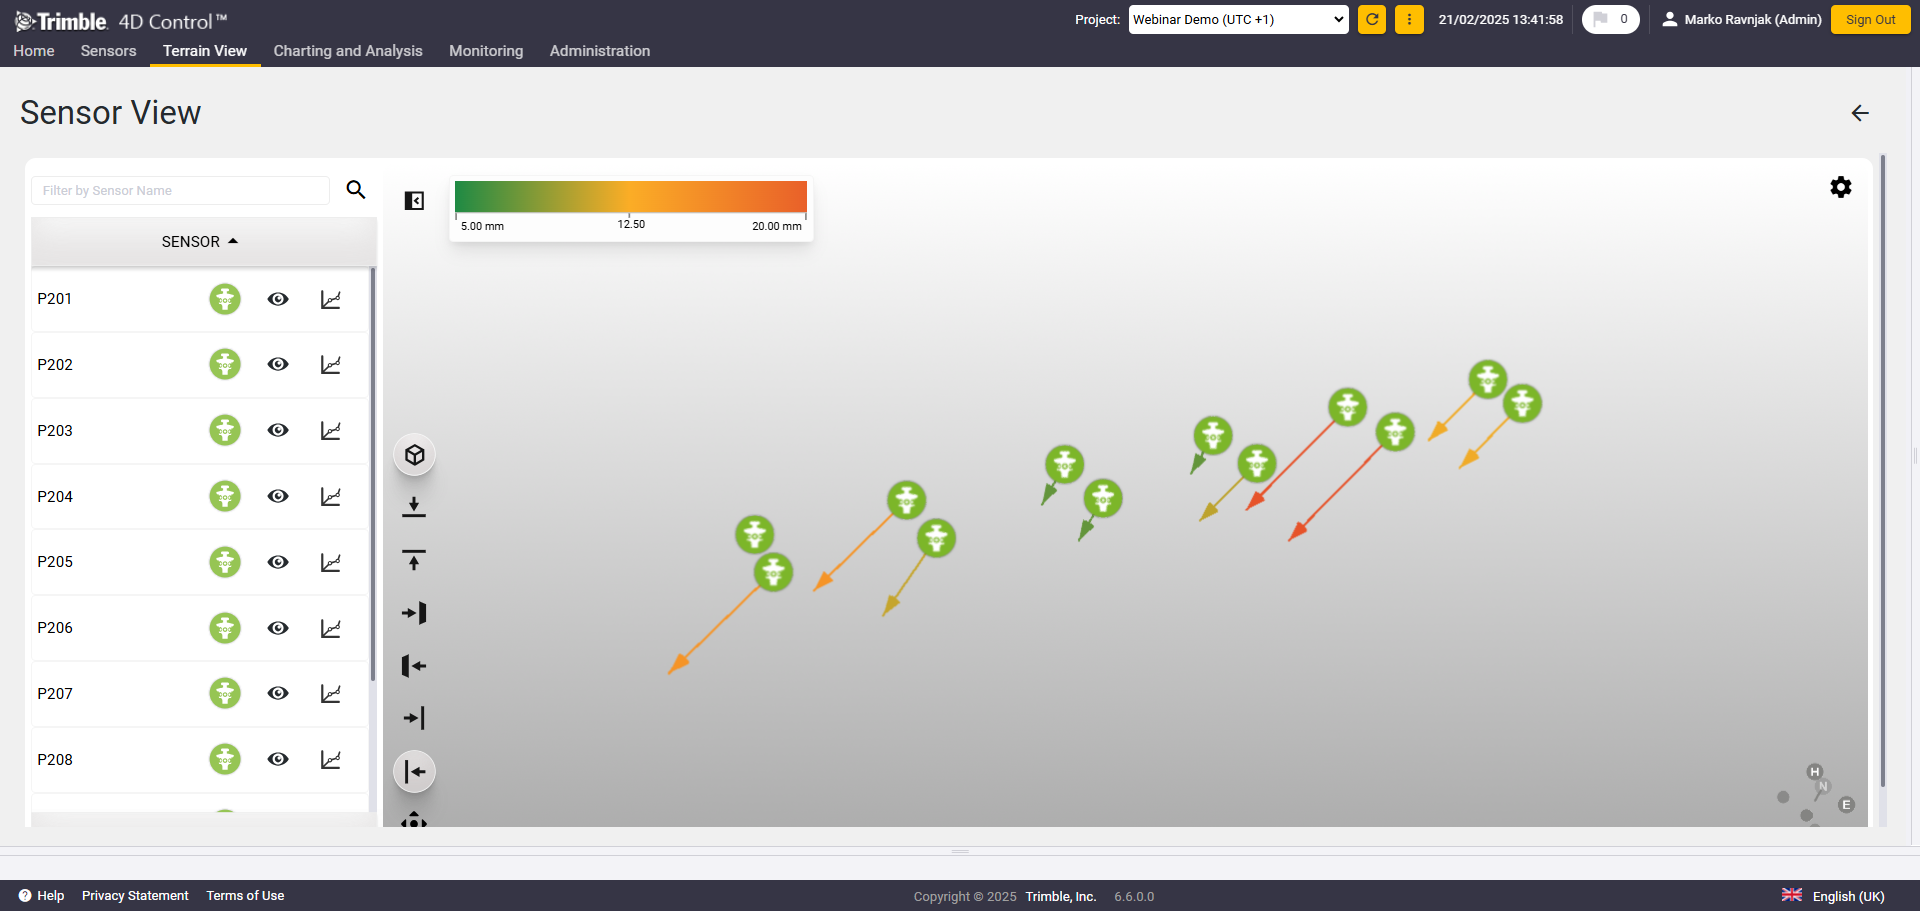
Sensors and vector displacements in 3D space
Add a new model to a project easily: upload a model and save it using a customizable or the default name (original model name). Once uploaded, view the model in 3D alongside project sensors without any other configuration. For positional sensors, vector displacements are also visualized, enhancing the overall movement analysis.
3D Viewer Functionalities
The 3D Viewer provides multiple functionalities designed to help users understand movement. To quickly orientate the model as desired, icons on the bottom left offer different model views: top, bottom, left, right, front, back, and axonometric. In this panel, users can fit the view to the model's coordinate limits. This is particularly useful to exclude sensors outside the model from the view.
On the left side of the view, sensors are listed with the option to filter them. Users can select a sensor from the list to open the sensor information window with the latest available data. A sensor can also be selected directly on the model and the selected sensor is marked yellow. Multiple selection is possible. The "eye" icon hides or displays the individual sensors and the "chart" icon next to it opens the specific sensor chart.
The chart opens below the model and allows to monitor the values over time. Adjust the time window using the time/date slider or insert values manually. Hovering over a specific value displays the values for that time stamp.
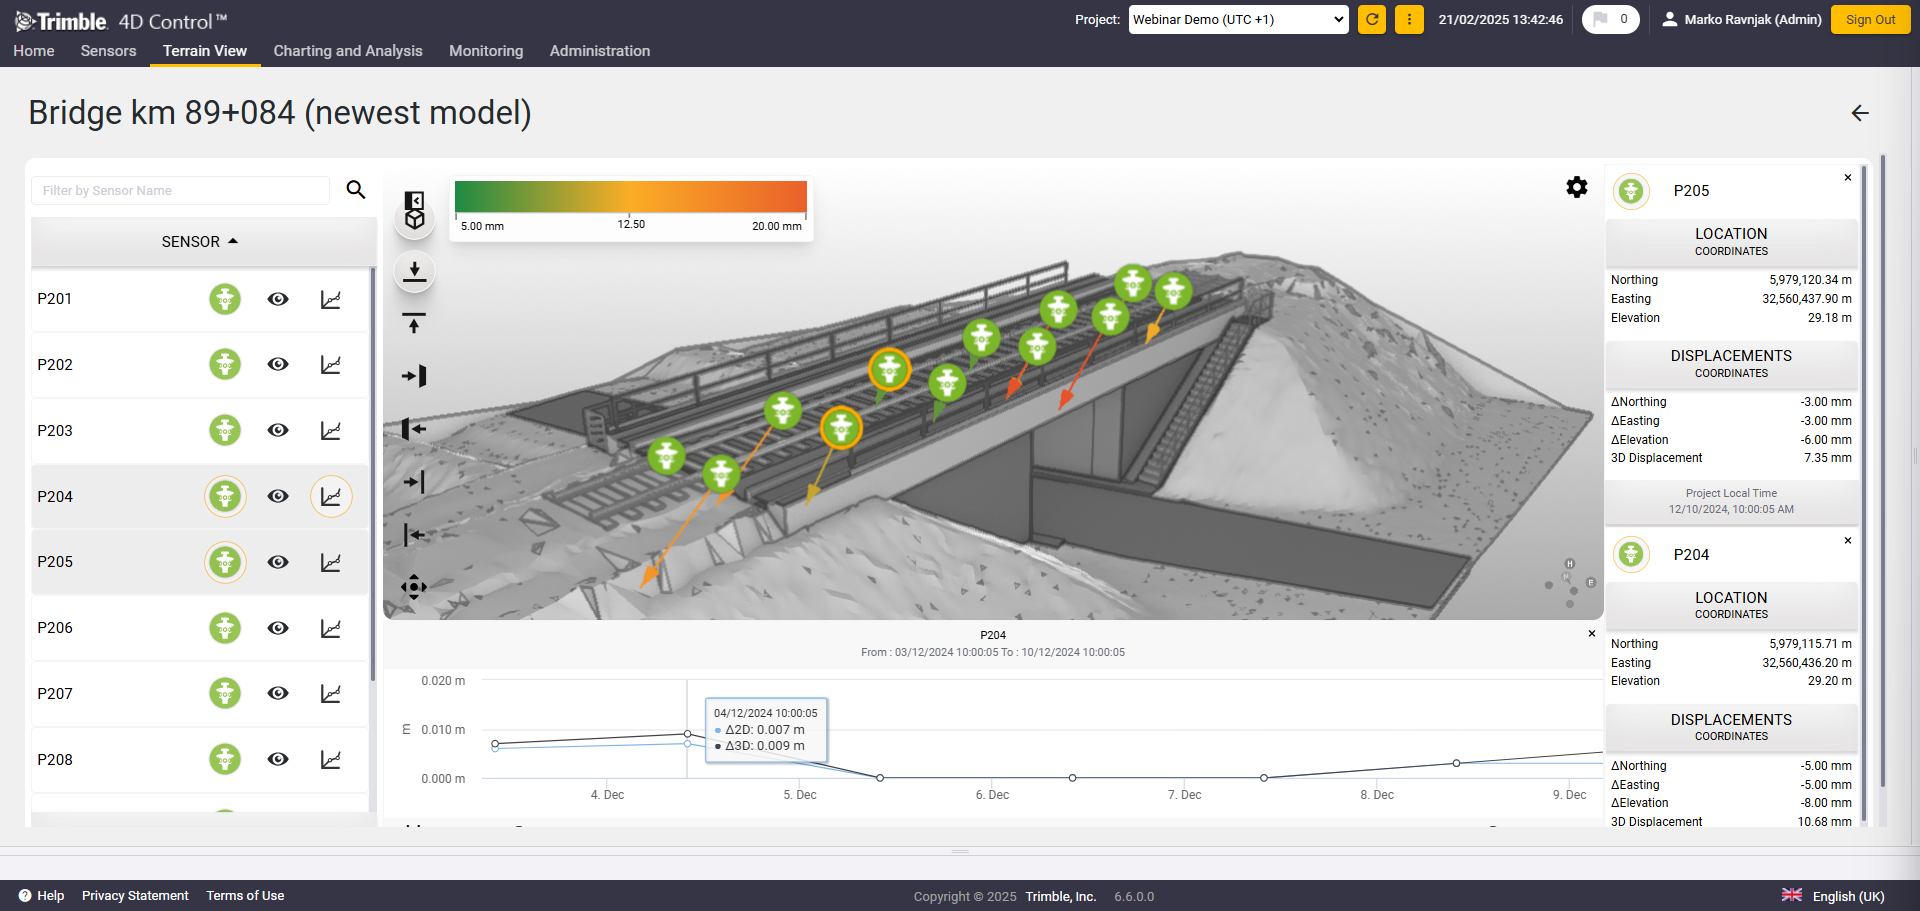
3D Viewer
Settings button, on the top right side of the screen, allows further adjustments to the model and sensors.
-
TimBIM Model - Allows you to hide or show the model
-
Displacement Vectors - Toggle the visibility of displacement vectors.
-
Sensor Icons - Show or hide sensor icons.
-
Sensor Visibility - Toggle between two sensor visibility options. When "Sensor always visible" is enabled, sensors will be displayed regardless of the view. If disabled, sensors that are, for example, beneath the model will not be visible in specific views, such as the top view.
-
Take a Screenshot - Capture the current view of the 3D model. To take a screenshot, click on the screenshot icon in the 3D Viewer. The screenshot will be taken and saved locally.
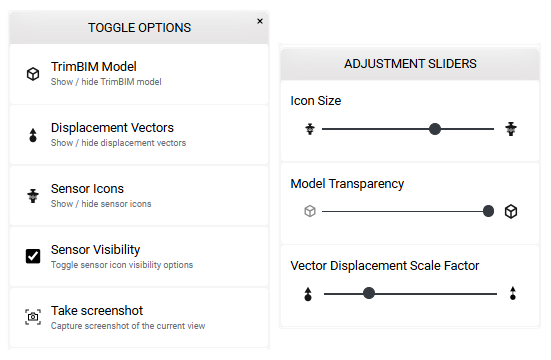
Toggle and adjustment options
In addition, use the adjustment sliders to change the model transparency, the sensor icon size, and the vector displacement scale factor.
Displacements use a color-coded visualization and the vector size to indicate the severity. Edit the following display parameters of the legend:
-
Minimum displacement threshold - displacements below this threshold are not shown.
-
Maximum displacement threshold - displacements above this threshold appear in red at maximum length/size.
-
Unit of measure and decimals – change the unit and number of decimals displayed.
For 3D visualization and positional sensors, sensor data is in 3D format and uses both height and 2D measurements to calculate displacement. Displacement visualization uses an arrow, with the length and color indicating the severity of the displacement.
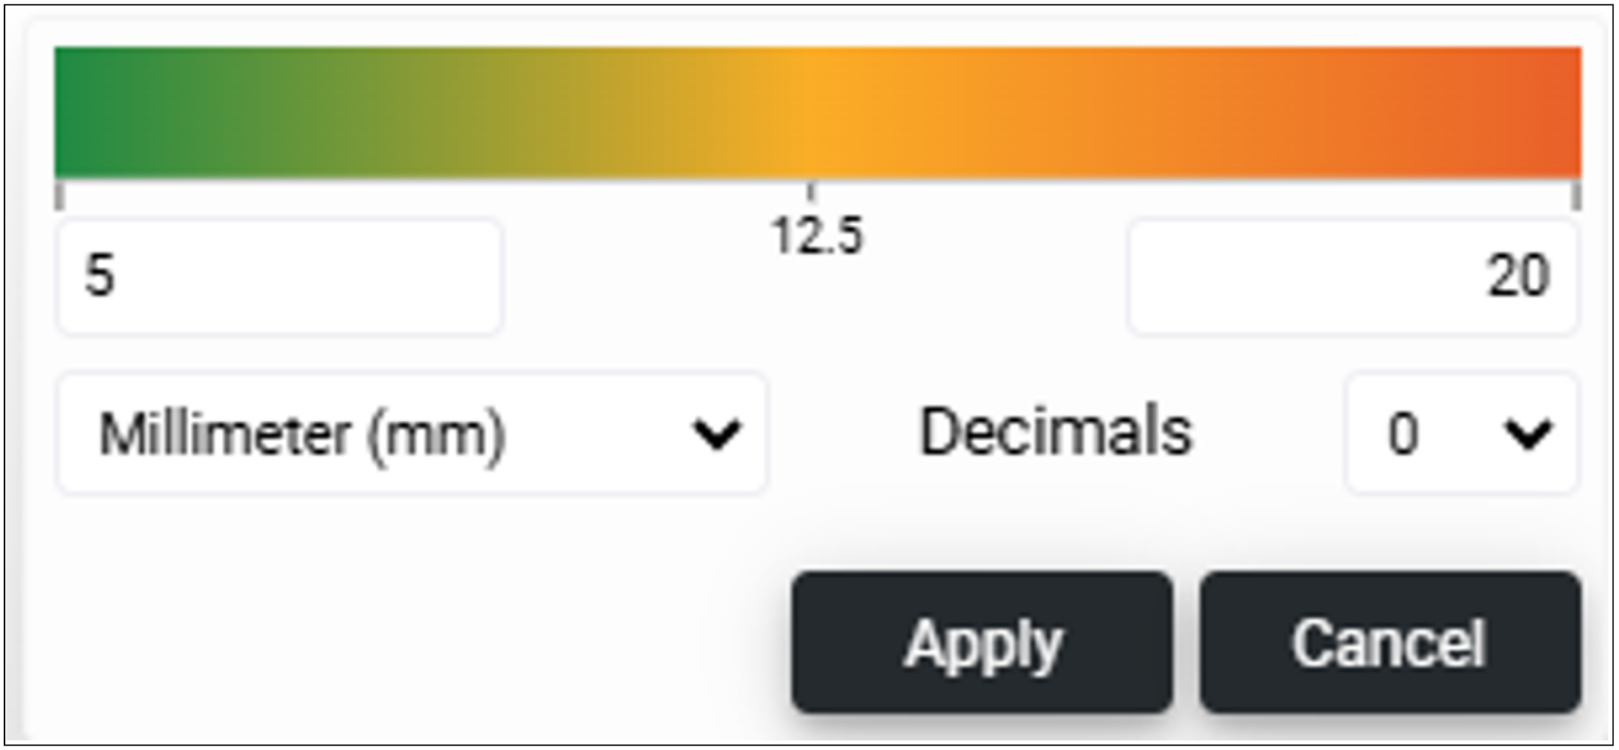
Vector Displacement Scale Factor
-
Geotechnical sensors must have defined grid coordinates to be displayed on the 3D model.
-
Geotechnical sensors cannot display displacement vectors, as this feature only applies to positional sensors.
-
Version 6.6 introduces the ability to manually place sensors on the map for georeferencing purposes when using a local coordinate system. During this process, approximate geographical coordinates are assigned to the sensors. However, these approximate coordinates are not converted to grid coordinates or used for 3D visualization.
Introducing Data Maintenance tailored to improve data quality
Faulty data in monitoring projects can arise from various sources, including backsight targets with poor quality being measured, backsight points missing in a measurement round leading to ppm correction changes, disturbance or positional change of a backsight point, but it can also be a user or instrument error that leads to erroneous data. In most cases, these issues result in spikes, outliers, or data not appearing in charts, analyses, trends, or to be shared with stakeholders. To address this, T4D now offers an option to remove erroneous data as part of the newly introduced 'Data maintenance' workflow.
Data Maintenance workflow
Data maintenance starts by selecting the sensors for the deletion of data. Various filters, such as text search, filter by sensor group, or filter by sensor type, help to narrow down the affected sensors. A specific filter allows users now to filter all targets measured by the same total station.
Once all relevant sensors are selected, the user confirms this, and T4D identifies other sensors, like calculation or virtual sensors, that are using data from the initially selected sensors as a component. In a next step, affected sensors are suggested, and the user can select the data to be deleted.
Once confirmed, the next window offers graphical support to identify the erroneous data directly from the chart for every sensor selected in the previous steps. Use the sliders in the chart to define the area with data to be deleted. Selected data in one chart applies to all other ones. It is possible to exclude a sensor with the ‘Delete button’ next to the sensor name on the chart. Additionally, the user can insert values directly to define a more precise time range. Once the selection is confirmed, a window summarizes the process and prompts the user to confirm again to execute the data deletion.
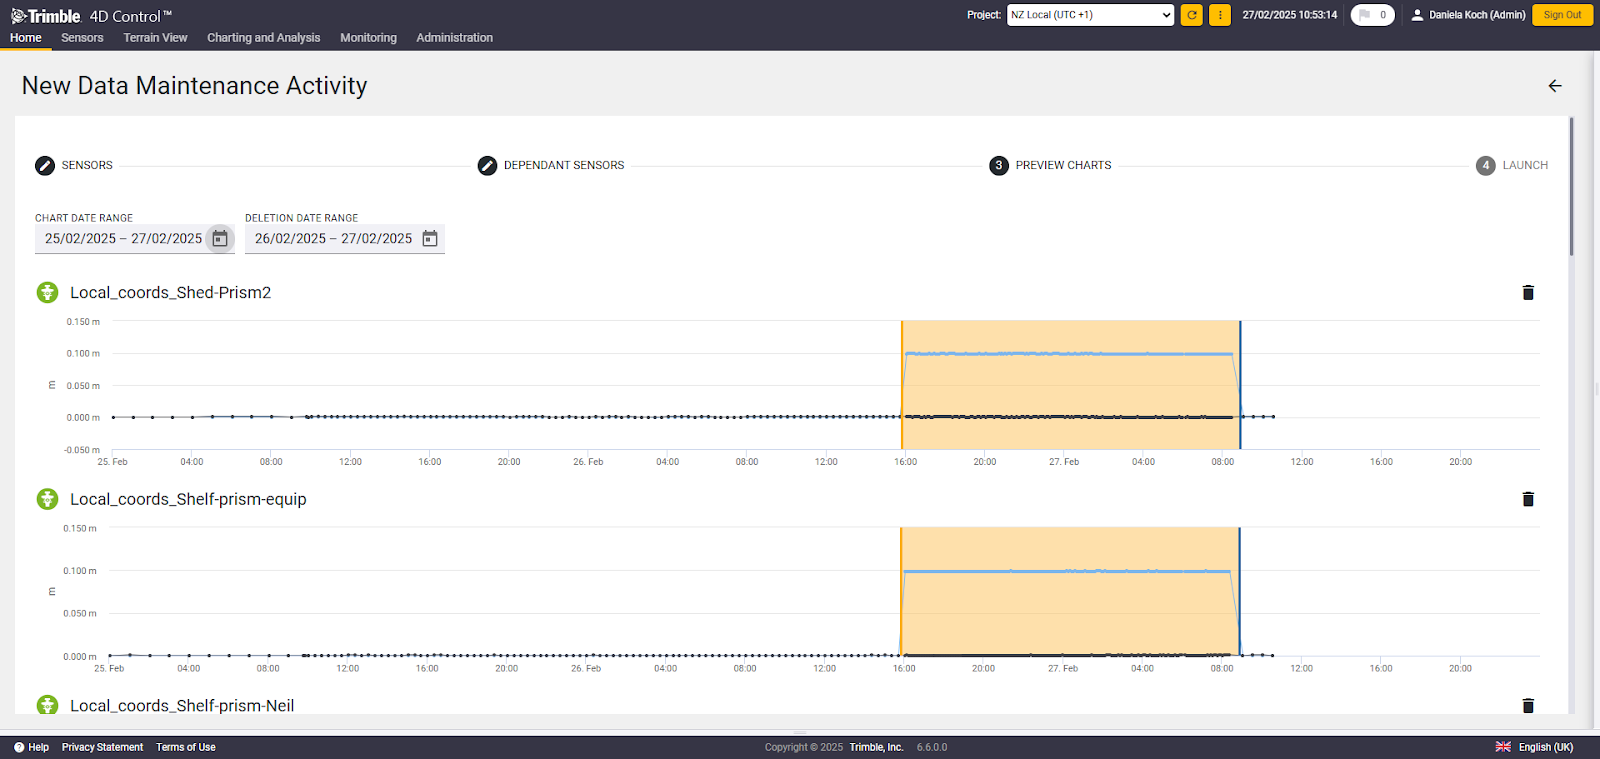
Selecting the time range to be deleted
Recalculations following Data Maintenance
For erroneous data, not only direct sensor observations and their components in virtual or calculation sensors have to be deleted during data maintenance, but also corresponding calculations. This includes observation reductions, which represent a summary of observations for a particular sensor and data type over a particular reduction period, as well as velocities. After a successful data maintenance, both the observation reductions and velocities are recalculated.
- The affected rail monitoring section will have to be manually recreated for the data removed by the data maintenance activity to apply in the T4D Rail module.
- To prevent inconsistencies between alarming history and current data, it is recommended that all data maintenance activities are well documented with comments in the Log section.
Tracking Data Maintenance
If data maintenance has taken place in the past, a record will be visible in the list, allowing users to revisit it and see details about the time of execution, how many sensors are affected, time range, who initiated the process and the current status. Here is also where the Log file can be accessed with additional information describing the steps of the whole process.
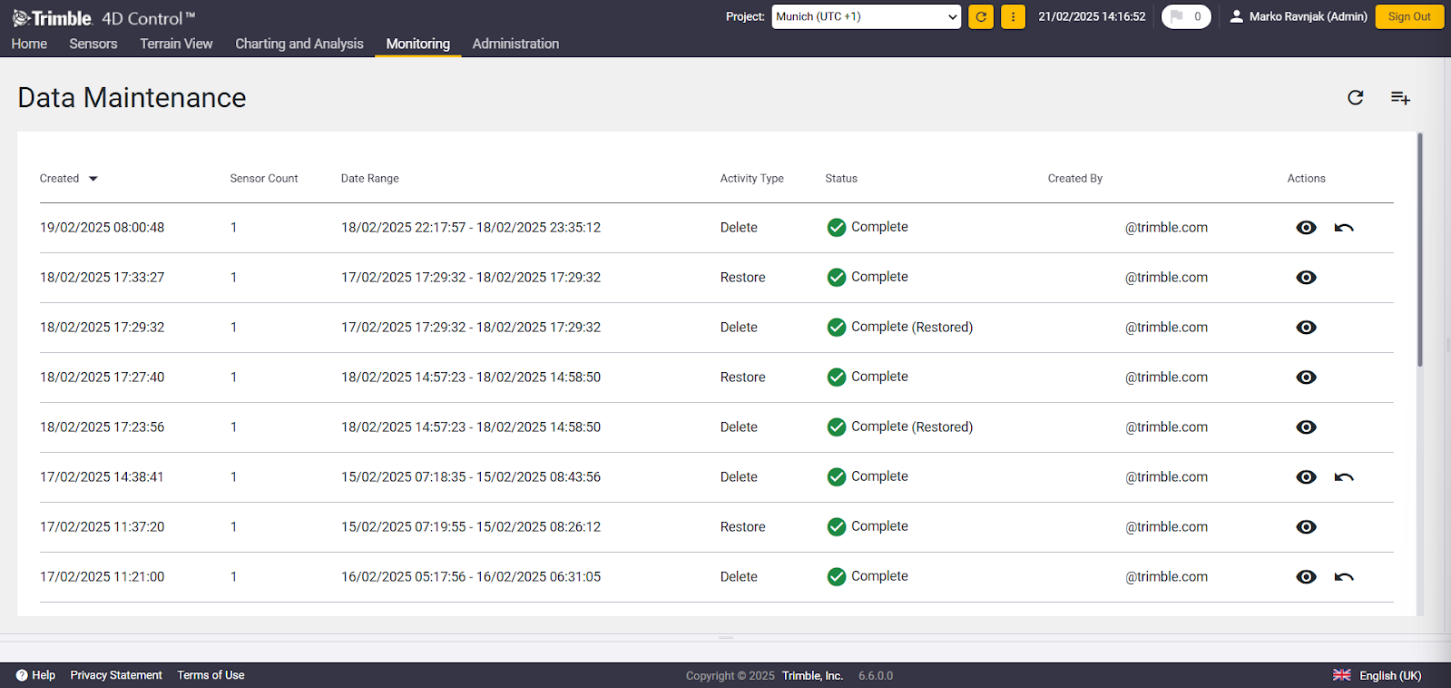
Data maintenance records
It is also possible to undo executed Data Maintenance by clicking on the 'Restore' button. This action restores the data to its state prior to execution and is also logged accordingly.
- Data maintenance actions are restricted to a rolling 7-day window of data that can be deleted at once. This helps maintain optimal system performance and responsiveness.
- Only administrators can delete data. This prevents accidental unauthorized data deletion.
- All administrators will receive an email notification when data maintenance starts and finishes (unless configured differently in email preferences).
T4D Maps Page can now be utilized in projects using a Local Coordinate System
The ability to visualize sensors and their movement on the map significantly improves insights to make decisions. With this version, map view can be used not only when the project is in a defined grid coordinate system but also when the local coordinate system is in use, increasing software usability and flexibility when setting up the project.
T4D now offers the possibility to place the sensors with defined local grid coordinates on the map, and a great part of that process is automated. After opening the map page, an instruction dialogue opens that informs the user about the sensor visualization and map configuration. After placing the sensors (usually two but this can vary depending on the sensor geometry) on the map, T4D calculates approximate parameters and can automatically place other sensors with a fitting projection. In case of a mistake, the user can cancel and retry, edit the values, or manually move the sensor.
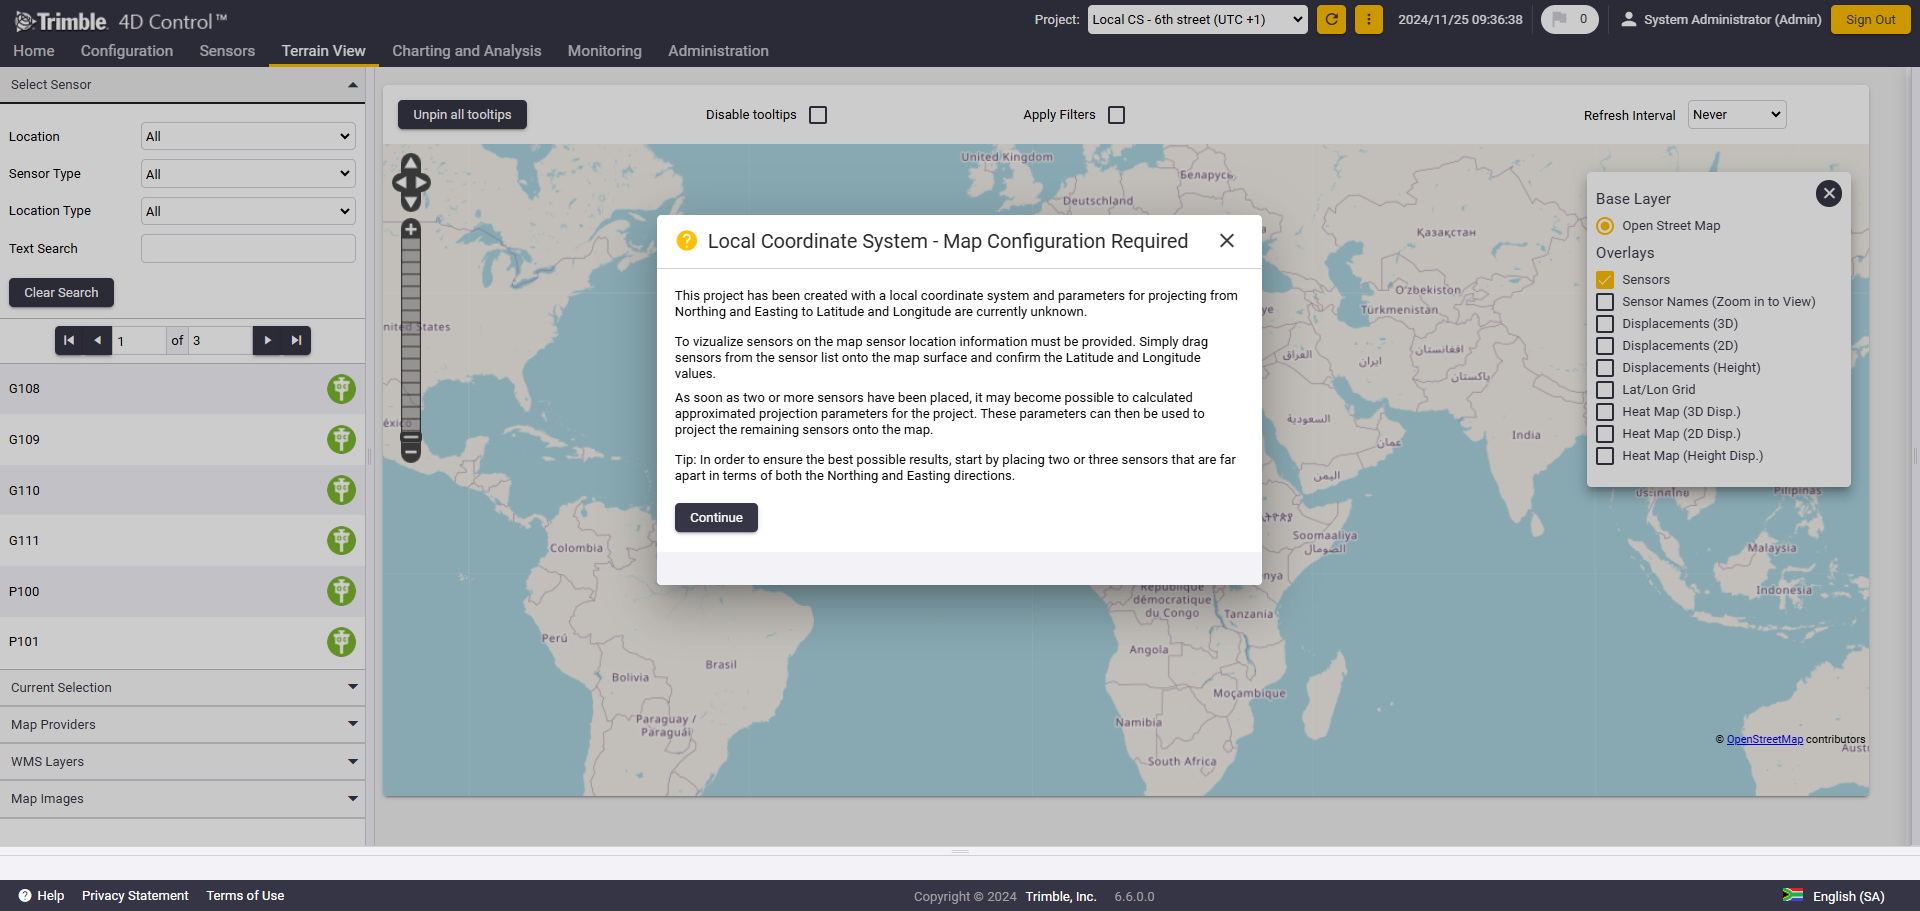
Map page with the configuration information
More sensors after initial placement can be added, allowing for further refinement of transformation parameters, leading to improved sensor placement accuracy. After a sufficient number of sensors is placed, an automated sensor placement option becomes available, offering to place sensors based on a calculated approximation. A Manage Locations section provides a status of the number of unplaced, user-defined, and approximated sensors. Finally, a reset function enables users to clear all placed sensors, facilitating a fresh start for the sensor placement process.
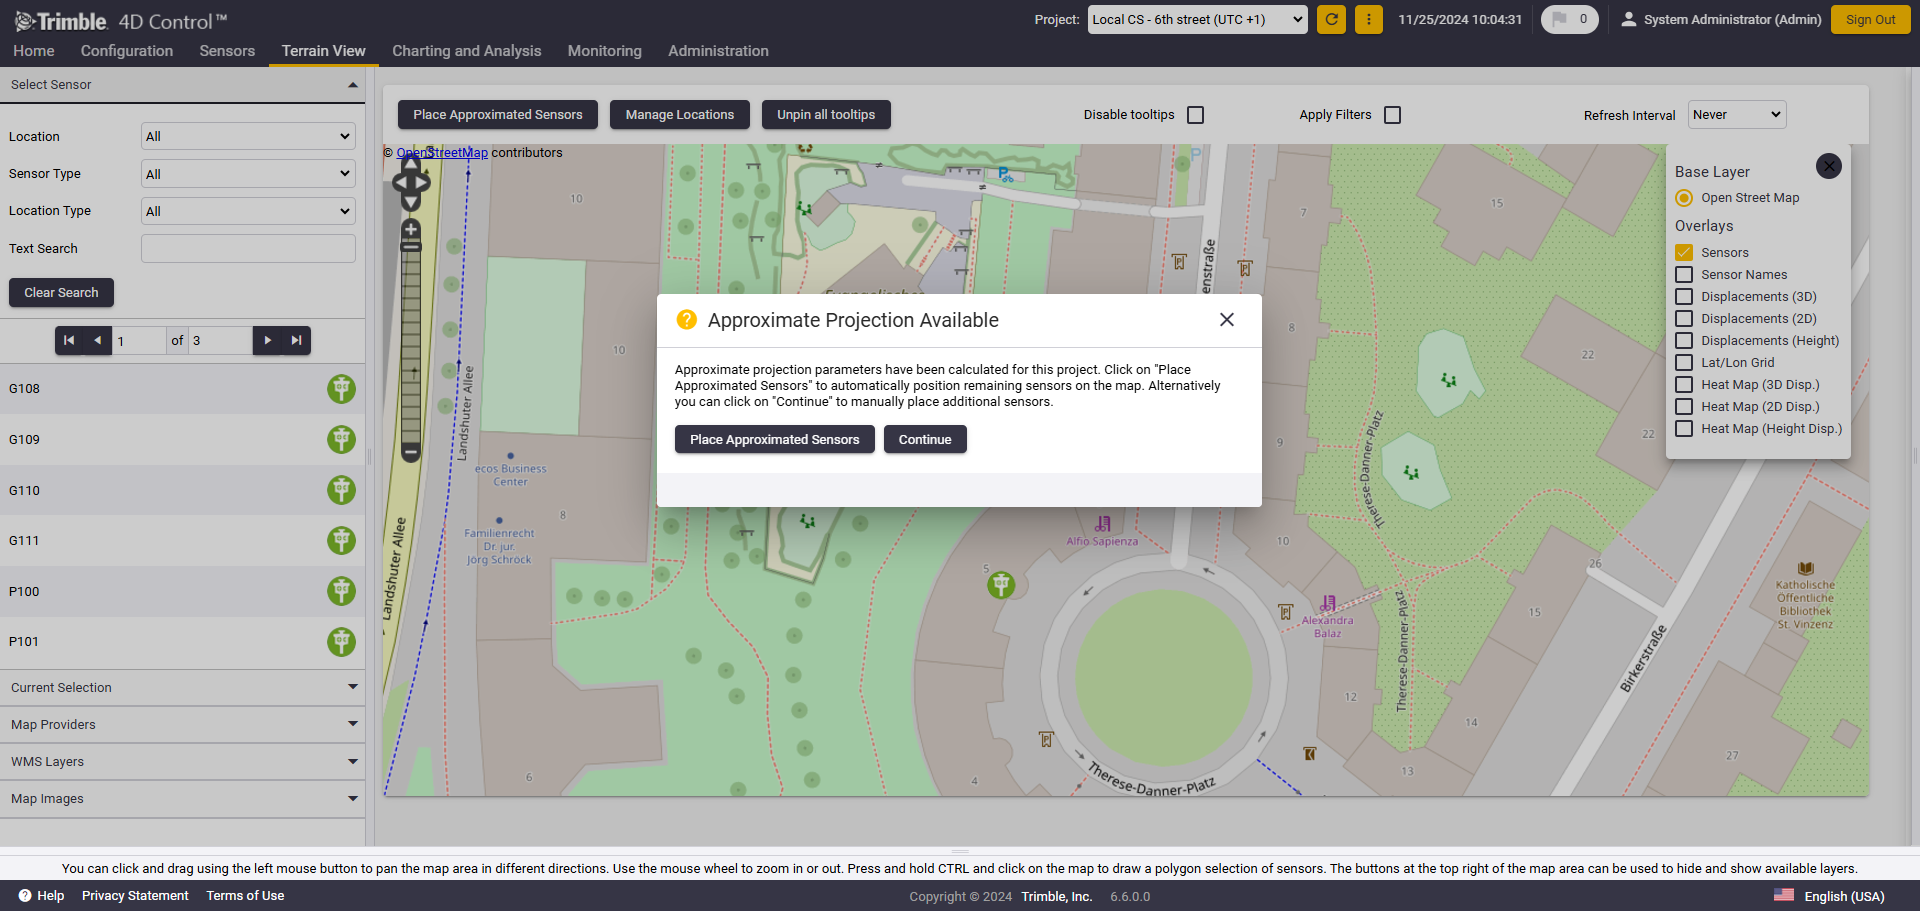
Approximate projection available after placing sensors
Select 'Continue' to proceed with the placement of more sensors on the map, to improve the transformation parameters. The button Place Approximated Sensors runs the automated sensor placement.
The Manage Locations button provides information about the number of unplaced, user-defined, and approximated sensors. The 'Reset' button removes all sensors from the map so that the sensor placement can be started from the beginning.
The user is notified, if not all sensors can be placed on the map based on the calculated projection. This happens due to a suboptimal geometry of already available sensors. Unplaced sensors are automatically filtered in the sensor list and can then be placed manually on the map. Alternatively, the placement process can be repeated based on a different sensor distribution.
With this release, this new feature introduces changes to the existing sensor location workflow:
-
Coordinate editing restriction - Positional sensor coordinate editing (Target and GNSS) is no longer allowed during sensor creation or editing.
-
Decoupling of coordinate updates - Updating geographic coordinates (latitude/longitude) by moving the sensor on the map will no longer trigger automatic updates of the grid coordinates. This is due to the fact that latitude and longitude values are used for display purposes only.
-
Removal of the Location Edit button - The Location Edit button has been removed from the Sensor View Page. Sensor location editing is now performed exclusively in the sensor editing workflow.
With the release of T4D version 6.6, this new feature introduces changes to the existing sensor location workflow:
-
Coordinate editing restriction - Positional sensor coordinate editing (Target and GNSS) is no longer allowed during sensor creation or editing.
-
Decoupling of coordinate update - Updating geographic coordinates (latitude/longitude) by moving the sensor on the map will no longer trigger automatic updates of the grid coordinates. This is due to the fact that latitude and longitude values are used for display purposes only.
-
Removal of the Location Edit button - The Location Edit button has been removed from the Sensor View Page. Sensor location editing is now performed exclusively in the sensor editing workflow.
-
Geotechnical sensors will only appear on the map if their grid coordinates are defined in the local coordinate system. If a sensor has no grid coordinates defined, it can still be placed manually on the map.
-
Geographical coordinates (latitude and longitude) assigned to sensors are only for display purposes and cannot be used for calculation or monitoring purposes
Coordinate Exporter module now supports ISE and GNSS results
The Coordinate Exporter module now supports the export of results (coordinates in the selected coordinate system) generated by both the Integrated Survey Engine and GNSS engines (RTK and Post Processing). Users can configure the upload to a specific location (e.g. a SFTP server) at defined intervals for further use.
This feature applies to both T4D Advanced and T4D Intermediate editions, as GNSS processing is enabled in these versions. It is particularly beneficial for intermediate users, where the processed data is typically integrated into other applications.
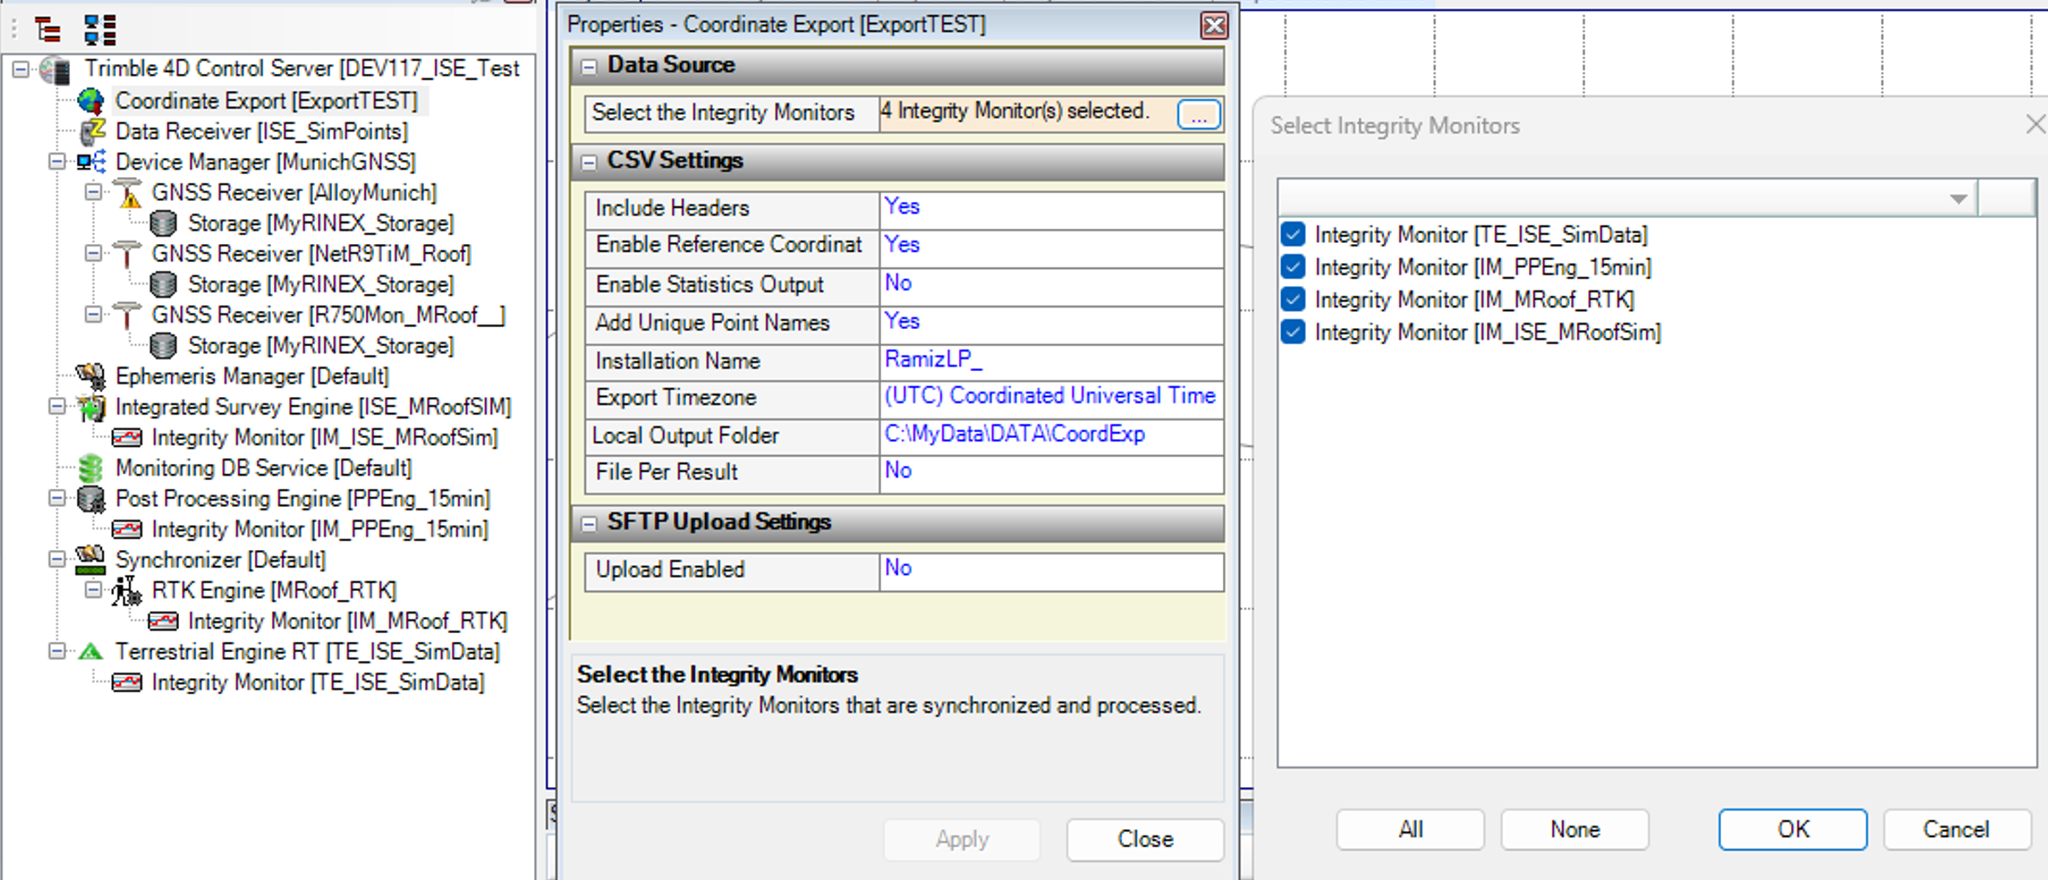
Selecting Integrated Survey and GNSS engines in Coordinate Export module
Support for MPS566 GNSS receiver
T4D v6.6 introduces support for the GNSS receiver MPS566. This receiver is designed for harsh environments and has a weatherproof, high-impact-resistant housing. Its high reliability makes it ideal for monitoring applications. The dual-antenna support allows the connection of two GNSS antennas to monitor two GNSS points with a single receiver. This capability is particularly useful for applications such as bridge monitoring or building construction.
Customized monitoring configuration can be purchased to be used in combination with the device.
The MPS566 and monitoring configurations are available in the APAC region in the Geospatial Store - ASIA section.
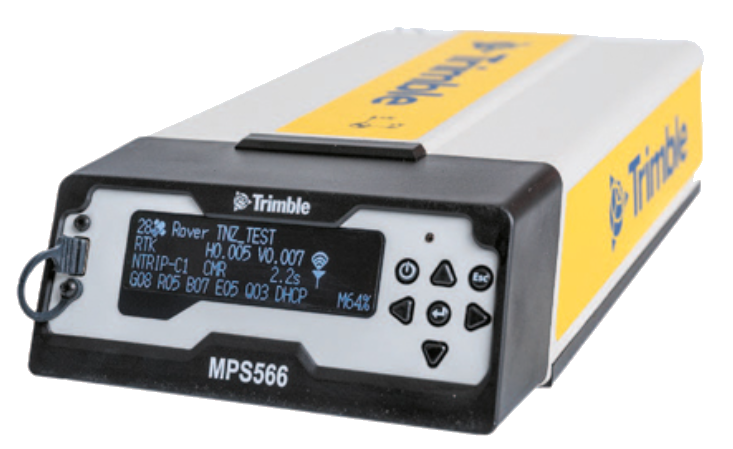
Trimble MPS566 GNSS receiver
Support for GNSS Meter
This new 6.6 version of T4D supports the new GNSS Meter, powered by Worldsensing. GNSS Meter is a new tool designed for mining, construction, and infrastructure industries, tailored to minimize the risks associated with land instability throughout a project's lifetime. It offers a user-friendly setup and an intuitive interface enabling rapid deployment of a high number of sensors with minimal training, making it highly scalable. It leverages wireless IoT technology to minimize infrastructure costs, eliminating the need for extensive cabling and reducing maintenance expenses.
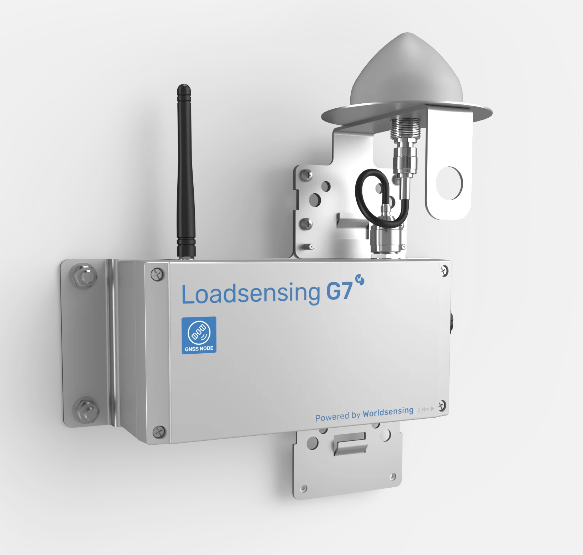
GNSS meter
Low-cost GNSS featuring RTK technology
The GNSS Meter features multi-band Real-Time Kinematic (RTK) technology and edge processing. A base station must be installed on a point with known coordinates where no movement is expected. The base plays a pivotal role in the network since, as it tracks satellite signals to determine any discrepancies caused by atmospheric interference or other distortions, which are then sent to rovers as correction data. Rovers, as opposed to base stations, are installed where movement is expected and needs to be monitored. There is no information about the rovers' exact position, so they use corrections received from the base station to correct errors in the satellite signals, making it possible to calculate accurate and reliable positions on the device. The RTK corrections are received via LoRa (Long-Range) communication, and the GNSS Meter then transmits sensor data and performance statistics to the Trimble gateway using the same principle. The gateway uses an available internet connection (cellular or ethernet) to send the data to CMT Edge, from where it is transmitted to T4D. Since the GNSS Meter communicates measurement messages via Gateway, data injection in T4D has not changed compared to the existing workflow used for geotech sensors such as tiltmeters or data loggers. After the connection to the Gateway in T4D Web is established, available sensors are displayed. If GNSS Meters are available, they and the appropriate data types can be selected for import as sensors in T4D Web.
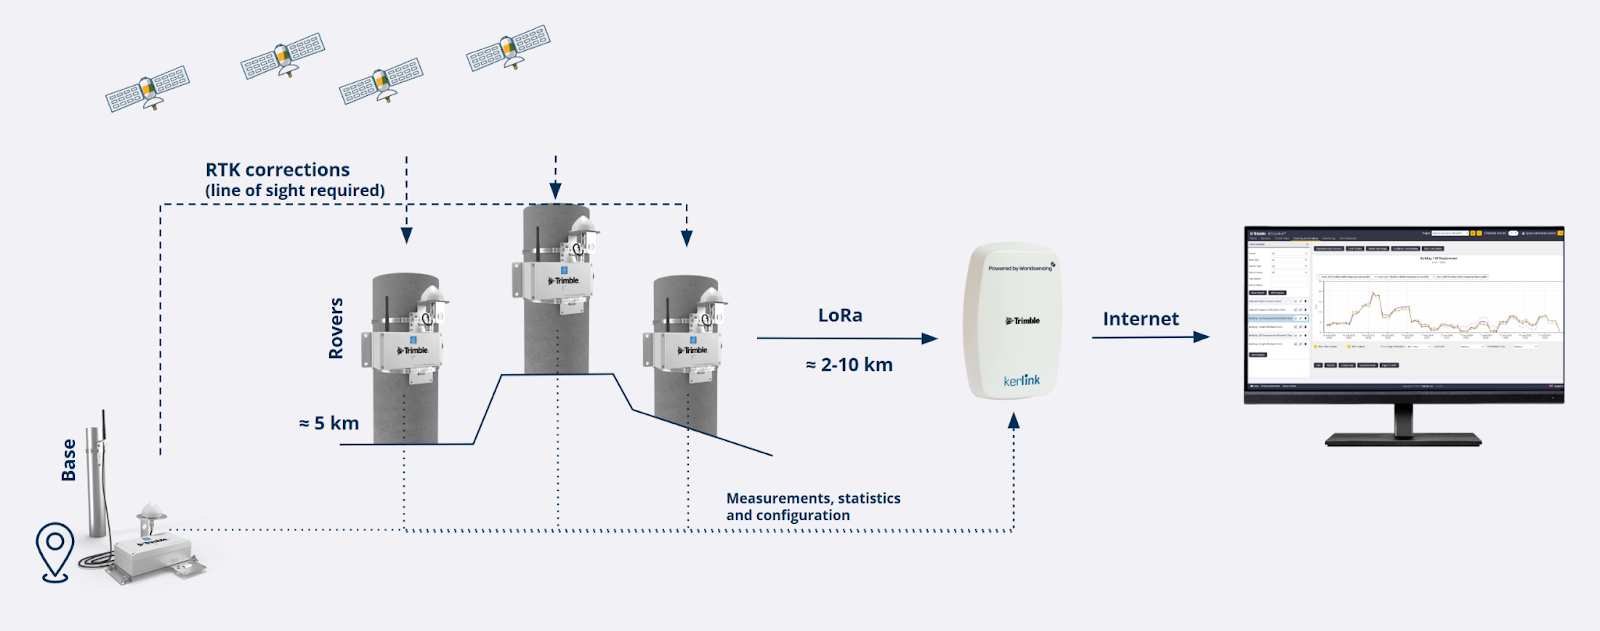
GNSS Meter working principle
For assistance and additional information on GNSS Meter installation, please refer to the User Guide provided with the device.
Comprehensive data delivered by the GNSS Meter
The GNSS Meter, as a multisensor device, delivers multiple data types but is treated as a single sensor in T4D.
Data that can be read in T4D v6.6 includes
-
3D coordinates (WGS84) for the time windows of:
-
1-hour - the last available coordinate result derived from RTK fix measurements of that hour
-
6-hour - coordinate result derived from RTK fix measurements of the last 6 hours
-
24-hour average - coordinate result derived from RTK fix measurements of the last 24 hours
-
-
Tilt meter readings
-
Temperature data
-
Epochs (Samples)
-
1-hour - the number of RTK fixed measurements in the last hour
-
6-hours - the number of 1-hour results with RTK fixed measurements that are used for the 6-hour result calculation
-
24-hours - the number of 1-hour results with RTK fixed measurements that are used for the 24-hour result calculation
-
All coordinates share the same timestamp, as new readings also trigger the recalculation of the 6-hour and 24-hour averages. Since the device reports coordinates in WGS84 by default, a coordinate transformation to grid coordinates is performed in T4D, ensuring coordinate system consistency within the project.
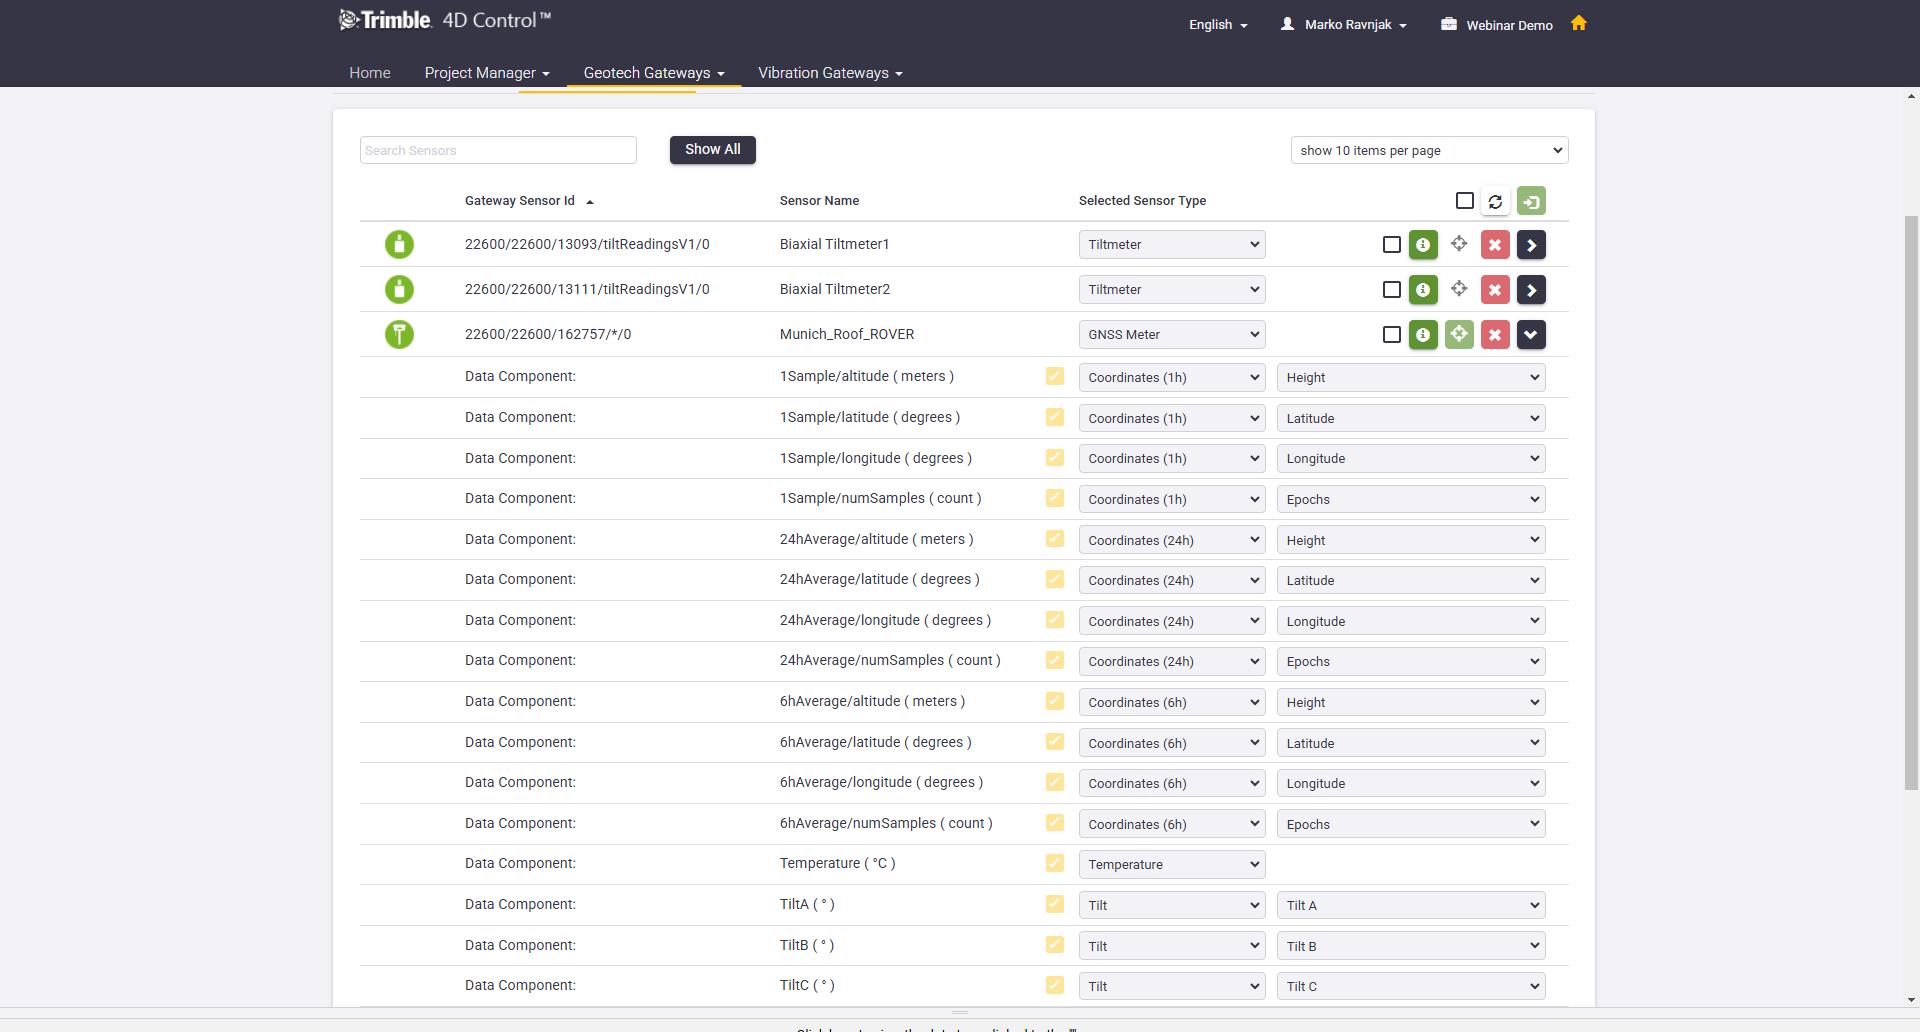
Available GNSS Meter data during T4D import
-
A coordinate system must be defined to use the GNSS Meter with T4D. The default (not specified) coordinate system is not supported.
-
The GNSS Meter also delivers GNSS statistical data to the gateway. This data is not available in T4D but can be accessed if necessary.
-
Configure the GNSS Meter to obtain information on displacements as part of the Engineering Units workflow on CMT Edge. This data is currently not supported in T4D.
-
The user must manually input the Base unit's coordinates after adding the sensor to T4D. This is done within the 'Location' section of the 'Edit Sensor' workflow.
-
GNSS Meter data types do not currently support trend calculations or velocities.
Licensing requirements
GNSS Meter is a multisensor device equipped with a GNSS board and tilt and temperature sensors. Due to its broad capabilities beyond GNSS, it is classified as a geotechnical sensor within the Trimble T4D ecosystem. This classification requires a geotechnical node to work with T4D.
Improvements
New icons in T4D Web
Version 6.6 introduces new sensor icons, bringing a refreshed look and feel to T4D Web. These new high-resolution SVG icons offer improved and smoother interactions, enhancing the overall user experience.
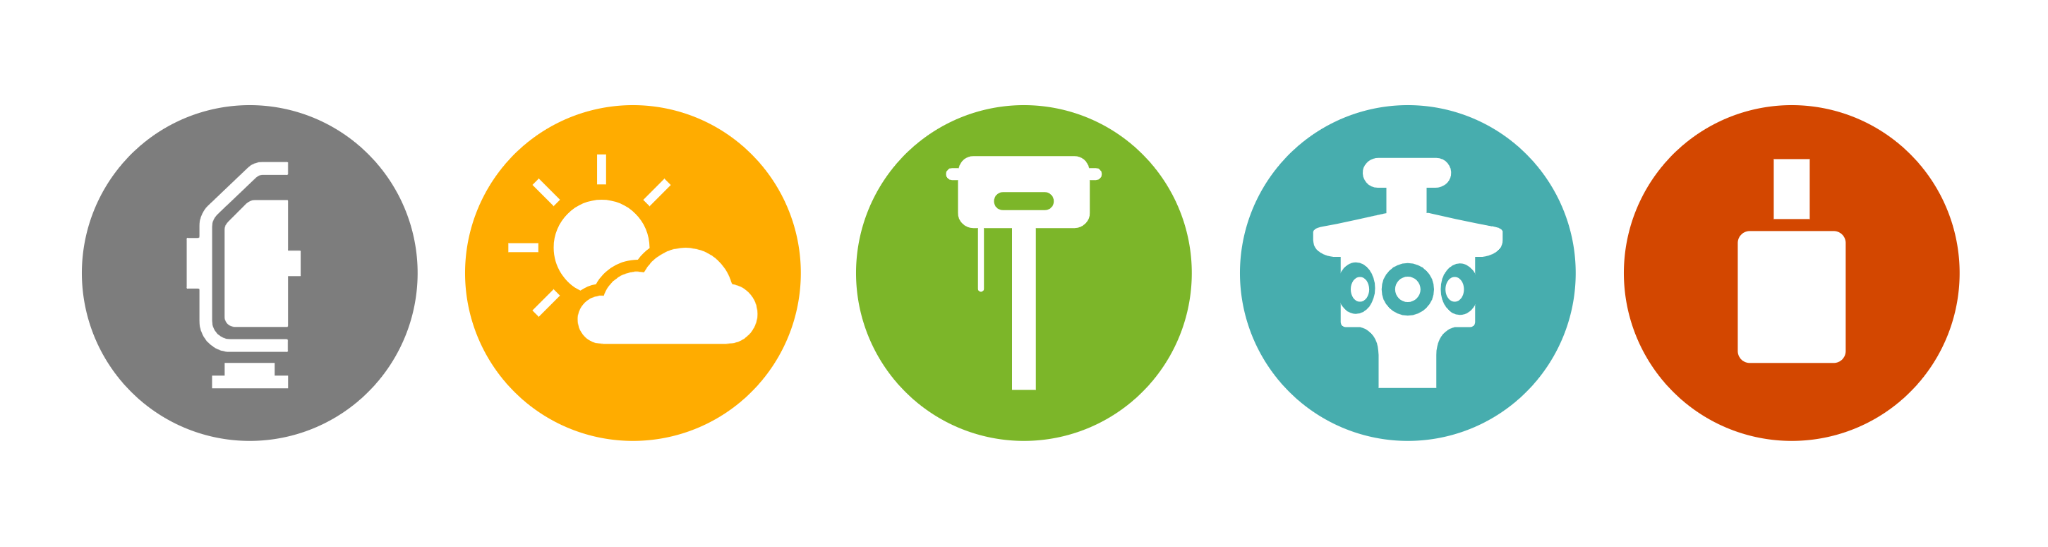
Examples of new icons
Geotech node default number increased from 5 to 10
Regarding smaller-scale project requirements, the number of default Geotech nodes included in T4D Advanced and Geotech editions has been increased from 5 to 10. This change applies to new T4D Advanced and T4D Geotech Edition licenses.
Analysis charts and reports enhancements
The normal analysis chart has been re-written in order to achieve faster performance. This applies both to charts in the web interface as well as reports.
The following analysis types remain unchanged:
-
Comparative Bar
-
Tabular Analysis
-
Windrose
-
Cross Section
The analysis report has been updated, and the data is now pulled from the database using a faster, more efficient logic. Charts in the analysis report are generated using new technology, allowing for substantially faster rendering. The resulting "Scalable Vector Graphic" format improves user interaction, such as zooming in and out, providing a better visual experience. This leads to charts in analysis reports being created more quickly and presented more effectively during user interaction.
Charts for all other analysis types still use the existing technology.
In addition to charts and report updates, Excel exports are now generated using the new data layer for all analysis types, enhancing overall performance.
Updated help content link in T4D Web
Trimble Field Systems has released a central information location Trimble Field Systems Help Portal about using Trimble field system products, including field, office, and cloud software, as well as data collectors and GNSS receiver system hardware. This includes the T4D Web Help portal. A direct connection to the portal has been established within T4D Web, providing easy access to additional information, support, and assistance while navigating T4D Web.
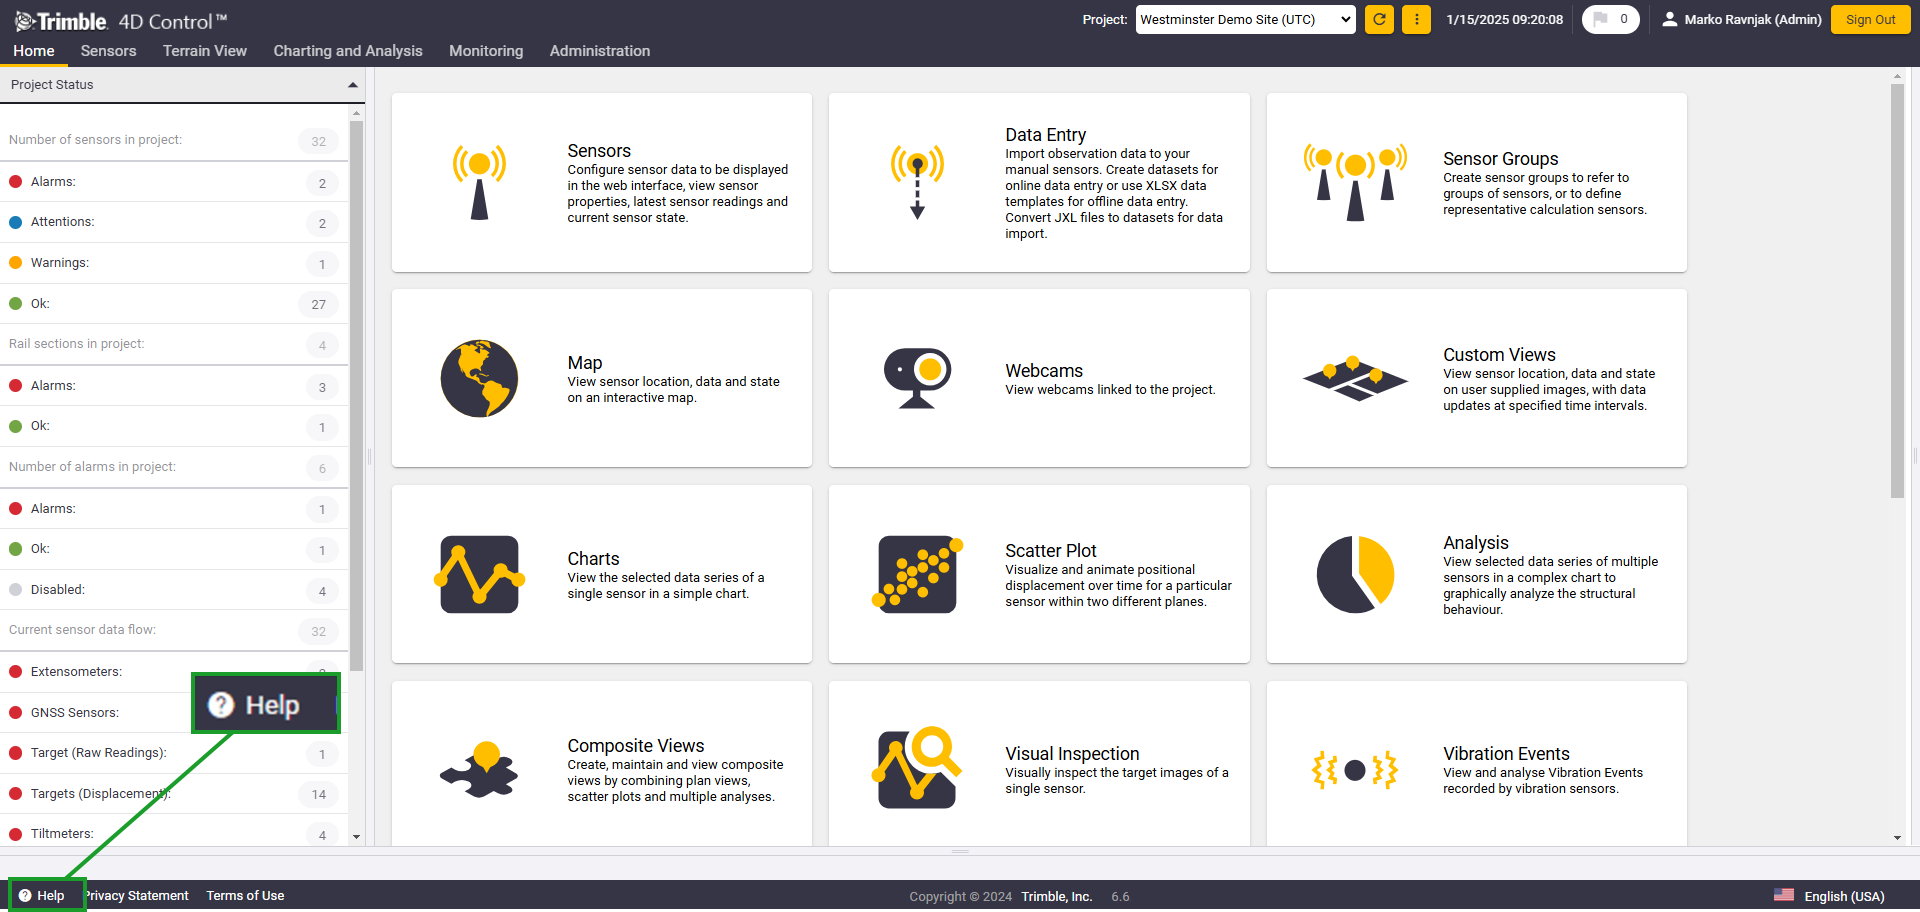
T4D Help Portal button in T4D Web
Trend and velocity calculations now possible using coordinates
Version 6.6 introduces enhanced analytical capabilities leveraging coordinates as a data type. You can now perform trend and velocity calculations using coordinates, enabling you to track movement patterns, analyze changes over time, and gain deeper insights from location-based data.
This update does not apply to the GNSS Meter data.
Resolved Issues
-
Active Directory access issue for T4D Admin Web - Resolved issue where a defined Active Directory (AD) user did not have rights to access T4D Admin Web.
-
RTCM decoder update - The RTCM decoder has been upgraded and its data stream decoding capabilities have been improved.
-
SQL Server issue affecting chart display - Resolved issue on the SQL Server side, causing charts not to be displayed in specific cases.
-
Modification in sensor locations - After importing new Geotech Gateway sensors or Vibration Gateway sensors, the T4D database now stores the location for each sensor separately, which allows for editing the location coordinates of each imported sensor individually without affecting the other.
-
Data Collector exception while processing GKA files - An exception was shown in case missing tilt information was reported by the instrument stopping the processing. This has now been resolved, and an error message containing the necessary information to allow processing is available.
-
Site Setup not possible due to defective temperature cable - Resolved issue where site setup was not possible due to a defective temperature cable. It is now possible to perform site setup (measure new targets) in cases where the temperature cable is broken, using the default temperature from the properties.
-
T4DDBImport Tool error - An error has been showing up during the data reprocessing workflow. This has been resolved.
-
Active Directory (Admin) user analysis rights issue - An issue has been resolved to allow Active Directory users to make analyses public and interact with created analyses.
-
Information storage in HistoryContMod table in T4D Server - previously, the T4D stored GNSS health information every second. The new update optimizes this by storing the information only when there is a change in the health status.
-
Active Directory integration now supports LDAPS - You can now choose between LDAP and LDAPS for secure sign-in and user migration, aligning with your Active Directory security policies.
-
Improved mm/m display for angular units - mm/m unit has been updated, making the previous recommendation of staying within a +/-10 degree range limit no longer applicable, thus allowing for more flexibility in angular measurements.
-
Improved unit symbol consistency - the unit library has been updated where 'US Survey Foot' is now consistently denoted as 'us-ft', and 'International Foot' as 'ft'. This change standardizes unit symbols across all features that utilize these units.
Miscellaneous
To update to T4D version 6.6, the warranty must be valid until at least 31 December 2024. If you have any questions or need assistance with updating or licensing, please contact your local Trimble distributor.
System Requirements
Supported Operating Systems
T4D version 6.6 supports the following operating systems:
-
Windows Server 2022 (end of support Oct 2031)
-
Windows Server 2019 (end of support Jan 2029)
-
Windows Server 2016 (end of support Jan 2027)
-
Windows 11 (end of support Oct 2026)
-
Windows 10* (end of support Oct 2025)
* Not recommended after October 2025, as Microsoft support for the operating system ends on October 14, 2025.
Recommended OS language is English, as certain regional settings may lead to compatibility issues.
Supported SQL Servers
T4D version 6.6 supports the following Microsoft SQL servers:
-
SQL Server 2022 (exp Jan 2033)
-
SQL Server 2019 (exp Jan 2030)
-
SQL Server 2017 (exp Oct 2027)
-
Azure SQL (n/a)
-
Trimble highly recommends using a full Microsoft SQL Edition that is not subject to memory capacity limits and is more performant (Standard or Enterprise Edition). This is particularly critical for monitoring systems with many sensors and processing engines where T4D Intermediate or T4D Advanced is used.
-
Trimble Monitoring highly recommends using the Latin1_General_CI_AS collation for the server, as it has been thoroughly tested and proven to work reliably.
-
The customer should not host any other web application on the IIS.
Supported Browsers
T4D Web is tested on the latest versions of Google Chrome, Mozilla Firefox and Microsoft Edge. Microsoft is retiring Microsoft Internet Explorer, which is no longer supported by T4D Web.
Deployment and Installation
T4D Download
-
The installer of T4D version 6.6 is available for download from the Trimble Monitoring website. Some additional information on the installer:
-
It is a single installer for all available T4D software editions (Access, Field, Intermediate, Geotechnical, and Advanced).
-
Depending on the selected software edition, the installer downloads only the required installation files.
-
The installer offers a "Download Media" option for an offline installation on a different server without internet access. In this case, the installer downloads the entire set of installation files for all software editions.
-
The T4D Access, T4D Field and T4D Geotechnical software editions include an automatic download and installation of Microsoft SQL Express 2022.
New installation
To install T4D version 6.6, please perform the following steps:
-
Run the T4D installer executable.
-
Choose the T4D software edition that matches your license.
-
Wait for the installation files to be downloaded.
-
Follow the instructions of the installation wizard.
Make sure you have your Microsoft SQL database administrator credentials available if you install the Intermediate or the Advanced Edition of T4D.
Upgrade of existing installations
Before you update your T4D to version 6.6, contact your Authorized Trimble Dealer to check if your license is valid for T4D version 6.6.
To update the software from a previous version to version 6.6, please perform the following steps:
-
Ensure that the existing installation of T4D is running on version 6.0 or later. If not, please update to version 6.0 or later at first.
-
Back up all T4D configuration files (*.tde) using the 'ConfigurationImportExport' tool available from the T4D Server installation directory.
-
Create database backups:
-
*.bak using the Microsoft SQL Server Management Studio for SQL databases
-
MongoDB - Next to a SQL database T4D is based on another database management system called MongoDB that handles the organization of monitoring data. For further information on its backup, please refer to this bulletin.
-
-
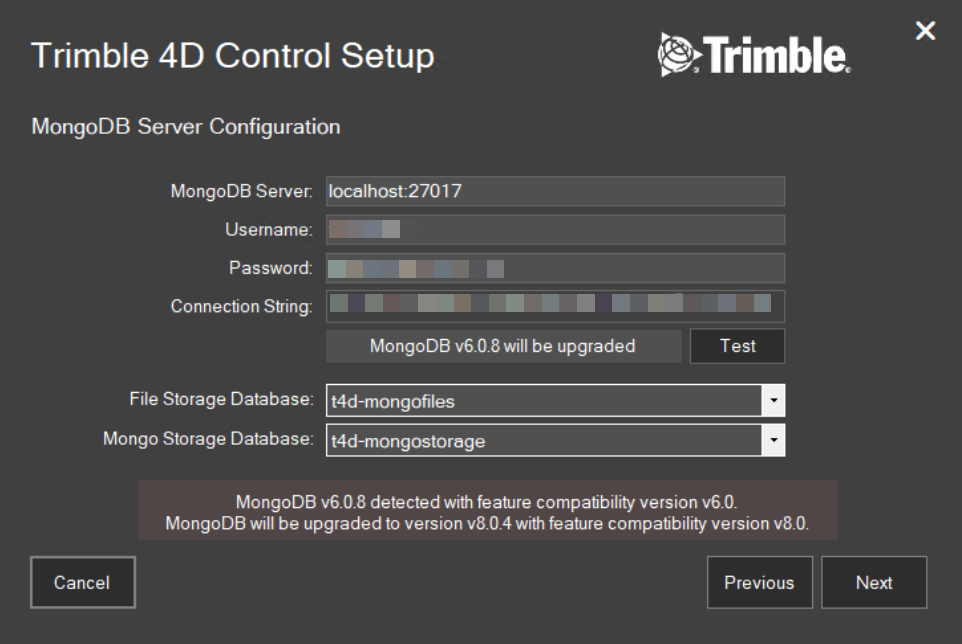
Run the installation of T4D version 6.6 by clicking on the 'Upgrade' tile. The installer automatically detects and uninstalls version 6.0 or later, before proceeding with the installation of version 6.6.
With version 6.6 the T4D installer automatically upgrades the MongoDB version to the latest version and ensures a seamless upgrade of T4D.
For more information, please contact monsol_support@trimble.com.
Appendix
Software Update v6.6.1
T4D software update 6.6.1 was released in March 2025 shortly after 6.6.0.
MongoDB 8.0 installation blocked on older machines
With the End of Life (EOL) for MongoDB 6.0 set for July 31, 2025, T4D v6.6 and later versions are bundled with MongoDB v8.0. However, some users operating T4D on older machines, where MongoDB 8.0 is unsupported, faced challenges in upgrading. Version v6.6.1 addressed this by allowing users to upgrade T4D and install MongoDB independently. If the machine is not supported, the installer will display a warning.
Disclaimer - with MongoDB 6.0 reaching EOL, security vulnerabilities will no longer be addressed, potentially compromising customer data. It is strongly recommended to upgrade your system and install T4D with MongoDB 8.0 to ensure data security.
Software Update v6.6.3
T4D software update 6.6.3 was released in July 2025. There is no software update 6.6.2.
Highlights of v6.6.3
This release introduces support for new Trimble hardware, improves stability across the platform, and offers greater flexibility in how you visualize your data. Key enhancements include compatibility with Trimble 'Lancet' GNSS receivers and the ability for all users to toggle between Modern and Classic analysis charts by default.
Enhancements
-
Expanded Hardware Support: T4D Control now supports the latest generation of the Trimble GNSS receiver for monitoring, allowing you to leverage the R750-MON-2 for your monitoring projects.
-
Flexible Charting Options: Version 6.6.0 of T4D introduced enhancements to analysis charts and reports, as detailed in the Analysis charts and reports enhancements chapter. With version 6.6.3, users now have the option to select between the modern Normal Chart (modern technology, enabled by default) and the Normal Chart (Classic) analysis types, allowing them to choose the technology that best suits their requirements.
Resolved issues
The following updates enhance performance and resolve issues in previous releases:
-
Analysis Report Exception - Resolved an issue where reports failed to run when plotbands for volts were used.
-
Data Logger Geotechnical Sensors - Addressed a bug that prevented geotechnical sensor locations from displaying correctly on the map.
-
Wrong sensor icons - An issue has been resolved that caused some sensors to display incorrect icons in the T4D Web 3D Viewer.
-
GNSS Meter Location Update - Resolved an issue that prevented changes to the GNSS Meter location.
-
3D Viewer Sensor Duplication - A bug causing sensor duplication in the 3D Viewer after specific actions has been addressed.
-
Frequent GNSS Messages - Reduced the frequency of GNSS messages to improve clarity.
-
Missing Horizontal Lines - An issue where the new analysis chart was missing horizontal gridlines has been resolved.
-
Custom Projection Calculation - Addressed a problem where custom projections for local maps incorrectly included data from deleted sensors.
-
Manual Sensor Mapping - Resolved an issue that prevented manually imported sensors from displaying on the map when using a formal coordinate system.
-
Coordinate Velocity Analysis - The calculation and display for 2D and 3D coordinate velocity analyses have been corrected.
-
3D Viewer Displacements - An issue preventing the display of displacement vectors for GNSS Meters in the 3D viewer has been resolved.
-
Classic Chart Options - The 'Show Logs' option is now correctly displayed and available for the Classic Normal Chart Analysis.
-
T4D Web File Uploads - Resolved a potential issue that could cause file uploads to fail after temporary folders were cleared on the web server.
-
Coordinate Analysis Series - An issue has been resolved that limited the availability of d2D and d3D coordinate analysis series in certain scenarios.
Software Update v6.6.5
T4D software update 6.6.5 was released in November 2025. There is no software update 6.6.4.
Security Update with v6.6.5
Trimble continuously delivers system and security updates designed to address the most recent cybersecurity threats. By keeping your Trimble 4D Control installation fully updated, you ensure that you benefit from our latest protections, safeguarding your data and maintaining the integrity and resilience of your monitoring operations.
This patch release addresses multiple issues and critical security enhancements to further strengthen the overall stability and integrity of user data and system processes.
Trimble strongly recommends that all users install this update without delay to ensure optimal performance and maximum protection.
Other updates
These additional updates enhance performance and resolve issues in previous releases:
-
Email Notification Performance Optimization - Implemented performance optimization for email notification handling, eliminating "jamming" and ensuring quicker system recovery following a mail server outage or failover
-
Password Reset Flow Update - The 'Forgot Password' flow now requires two-step confirmation for security. Additionally, users are automatically signed out upon a successful password change and immediately receive a confirmation email with recommended security actions if the change was unauthorized.
Software Update v6.6.6
T4D software update 6.6.6 was released in March 2026.
Main Updates
Unit of Measure
Version 6.6.6 introduces enhanced unit management, providing greater flexibility for displaying results across T4D Web. Users can now select a preferred unit system - Metric, Imperial, or US - to use the units relevant to that specific system, or an All Systems option for projects that require access to the complete range of supported units.
For Imperial and US settings, the update expands the preferred linear unit options, allowing results to be displayed in Inches, Miles, or Yards. This preference applies as a project-wide setting.
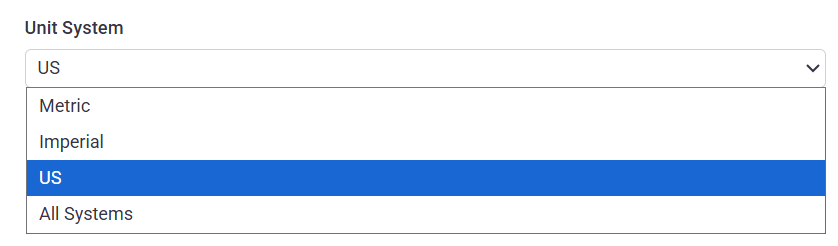
Selecting the Unit System
Alarm Notification
Users can now configure the delivery of secondary alarm emails to match specific project requirements. These notification emails include visual charts of the alarm event, supporting rapid decision-making for stakeholders who may not have immediate access to the T4D Web interface. Previously sent by default, secondary alarm emails now provide users the flexibility to enable or disable them based on specific project communication requirements.
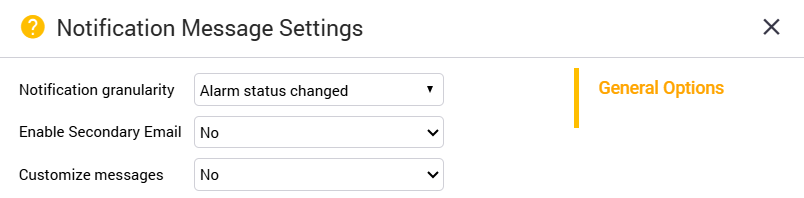
Enable Secondary Email setting in T4D Web
Hierarchical Alarm Notifications in T4D Rail
The Recipients section now supports tiered notification delivery based on defined threshold levels (Attention, Warning, and Alarm). This level-dependent approach ensures the appropriate stakeholders are informed as conditions escalate:
-
Attention: Sends notifications only to designated Attention recipients.
-
Warning: Sends notification to both Warning and Attention recipients.
-
Alarm: Sends notifications to all recipients across the Alarm, Warning, and Attention levels.
This structured hierarchy improves communication efficiency and prioritizes alerts according to severity.
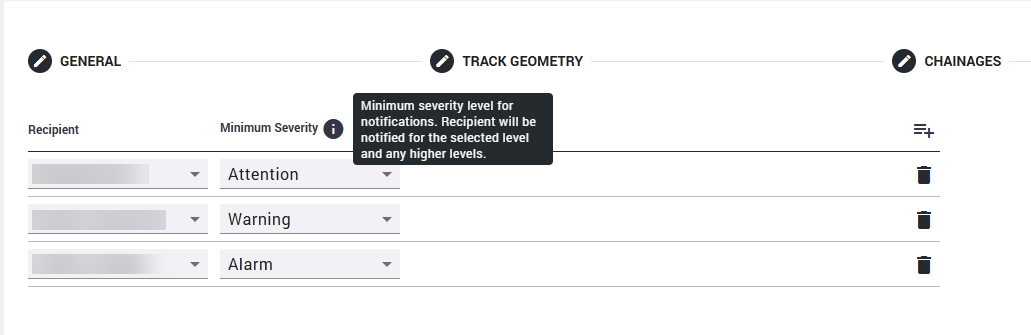
Selecting recipients in T4D Rail based on severity
Standard Deviation Filter Now Available in T4D Rail
A Coordinates Standard Deviation Filter has been added to the T4D Rail parameter section to support high-quality results. This feature allows users to filter coordinates based on their precision. If the standard deviation of any coordinate component (Northing, Easting, or Height) exceeds the defined limit, that coordinate is automatically excluded from parameter calculations.
Users can still configure the Observation Age parameter to determine if the last available observations should be used and define the maximum allowed age for these observations.
This filter is particularly helpful for maintaining calculation integrity in scenarios involving moving backsight points, network adjustments, or missing backsight points in case of resection.
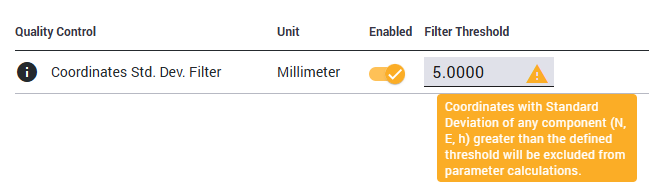
Standard Deviation Filter in T4D Rail
Geotechnical Sensor Integration Updates
Version 6.6.6 introduces integration for Worldsensing geotechnical sensors, ensuring compatibility with the latest hardware and software developments.
This release provides continued seamless data ingestion for users running CMT Edge version 2.11.1 with T4D adjusted to support the revised JSON message format delivered by GNSS Meters, maintaining uninterrupted monitoring workflows and data integrity.
T4D now supports the new Worldsensing tilt measurement format, applicable to both G6 and G7 tiltmeters, as well as tilt data provided by GNSS Meters.
Support has also been added for the new G7 Vibrating Wire (VW) sensors, enabling full integration of the latest generation of G7 VW data loggers, which Worldsensing will launch in April 2026.
- Trigger Measurement Mode - T4D v6.6.6 can now process additional readings captured by G7 nodes while operating in Trigger Measurement Mode.
-
Motion Detection Sensor Parameters - T4D v6.6.6 does not yet support parameters measured by the activation sensor (such as absolute angle, angular velocity, or acceleration) included in G7 Trigger Measurement statistics.
-
G7 Tiltmeter Functionality - Event Detection Mode for tiltmeters is not supported in this version.
-
Required post-upgrade action - Following the upgrade of the CMT Edge firmware on existing nodes, users must perform a refresh action to maintain data flow via Administration → Projects → Geotech Gateways → Available Sensors → Refresh button.
Other updates
These additional updates enhance performance and resolve issues in previous releases:
-
New GNSS Firmware Compatibility (Lancet v6.43) - Trimble GNSS firmware version 6.43, released in September 2025, has been validated and confirmed compatible with T4D.
-
T4D Rail - Missing Chainages - Resolved an issue that prevented the display of certain chainages in rail monitoring charts..
-
T4D Rail - Timing Issue with High Number of Tilt Sensors - Fixed timing problems affecting data synchronization when using a high number of tilt sensors for rail monitoring.
-
T4D Rail - Refined Logic for Managing Deleted Sensors - Improved handling of deleted monitoring sensors to ensure removal does not cause operational issues.
-
Normal Chart Analysis Report Issue - Resolved an issue regarding limitations encountered during the generation of reports involving a large number of sensors.
-
Analysis Report Update - Enhanced mechanism for capturing Analysis Charts to improve performance and reliability. This update resolves the Y-Axis Scaling issue, ensuring that custom Y-axis data ranges defined within the Analysis are accurately reflected in the Analysis Report.
-
Report Filtering Logic - Corrected an issue in the T4D Web Analysis report where all analyzes were automatically included in reports. This fix ensures scheduled reports remain within size limits for reliable automated delivery.
-
Report Time Zones - Resolved an issue to ensure time information within reports now reflects the Project Local Time.
-
Positional Sensor Readings Report Issue - Fixed an issue where selecting a large number of sensors generated a long URL exceeding character limits, preventing the Positional Sensor Readings report from loading.
-
MongoDB v8.0.17 Integration - T4D v6.6.6 now includes MongoDB v8.0.17, to maintain compliance with the latest security standards by replacing older, vulnerable versions of MongoDB with a verified, secure release.
T4D Control does not utilize Zlib compression for MongoDB connections. Therefore, vulnerabilities related to Zlib (such as those found in CVE reports) do not impact the security or operation of T4D Control.
-
Ensured Compatibility for Manual MongoDB Upgrade - This update ensures that T4D supports MongoDB instances that have been manually upgraded using an external installer.
-
Optimized System Startup Sequence - This update improves T4D and SQL Server synchronization. By optimizing service initialization, T4D ensures database dependencies are fully accessible before core services start.
-
Improved Installer Diagnostic Messaging - Enhanced system deployment experience by extended service timeouts. If a timeout occurs, users now receive a direct recommendation to initiate a re-run.
-
Language Settings – Italian – Fixed incorrect text titles when Italian language is selected.
-
T4D Web - 'Terms of Use' link - Fixed access to the Terms of Use page directly within T4D Web.
Release notice
This is the March 2026 release (Revision A) of the Trimble 4D Control Software Release Notes. It applies to version 6.6 and subsequent software updates (see Appendix section).
