Make and Save Measurements
The Measurements pane in the 3D Viewer allows you to create, view, and save measurements from your 3D model without loading a full desktop design package. Check a control point coordinate, verify a distance, calculate a slope, or measure an angle or the volume between surfaces. Measurements can be done with any pane open, but saved measurements are shown only on the Measurements pane.
Click the  Measurements icon on the left side to open the Measurements pane with tools to:
-
Perform measurements - Perform basic coordinate, distance, and slopemeasurements on your site data.
-
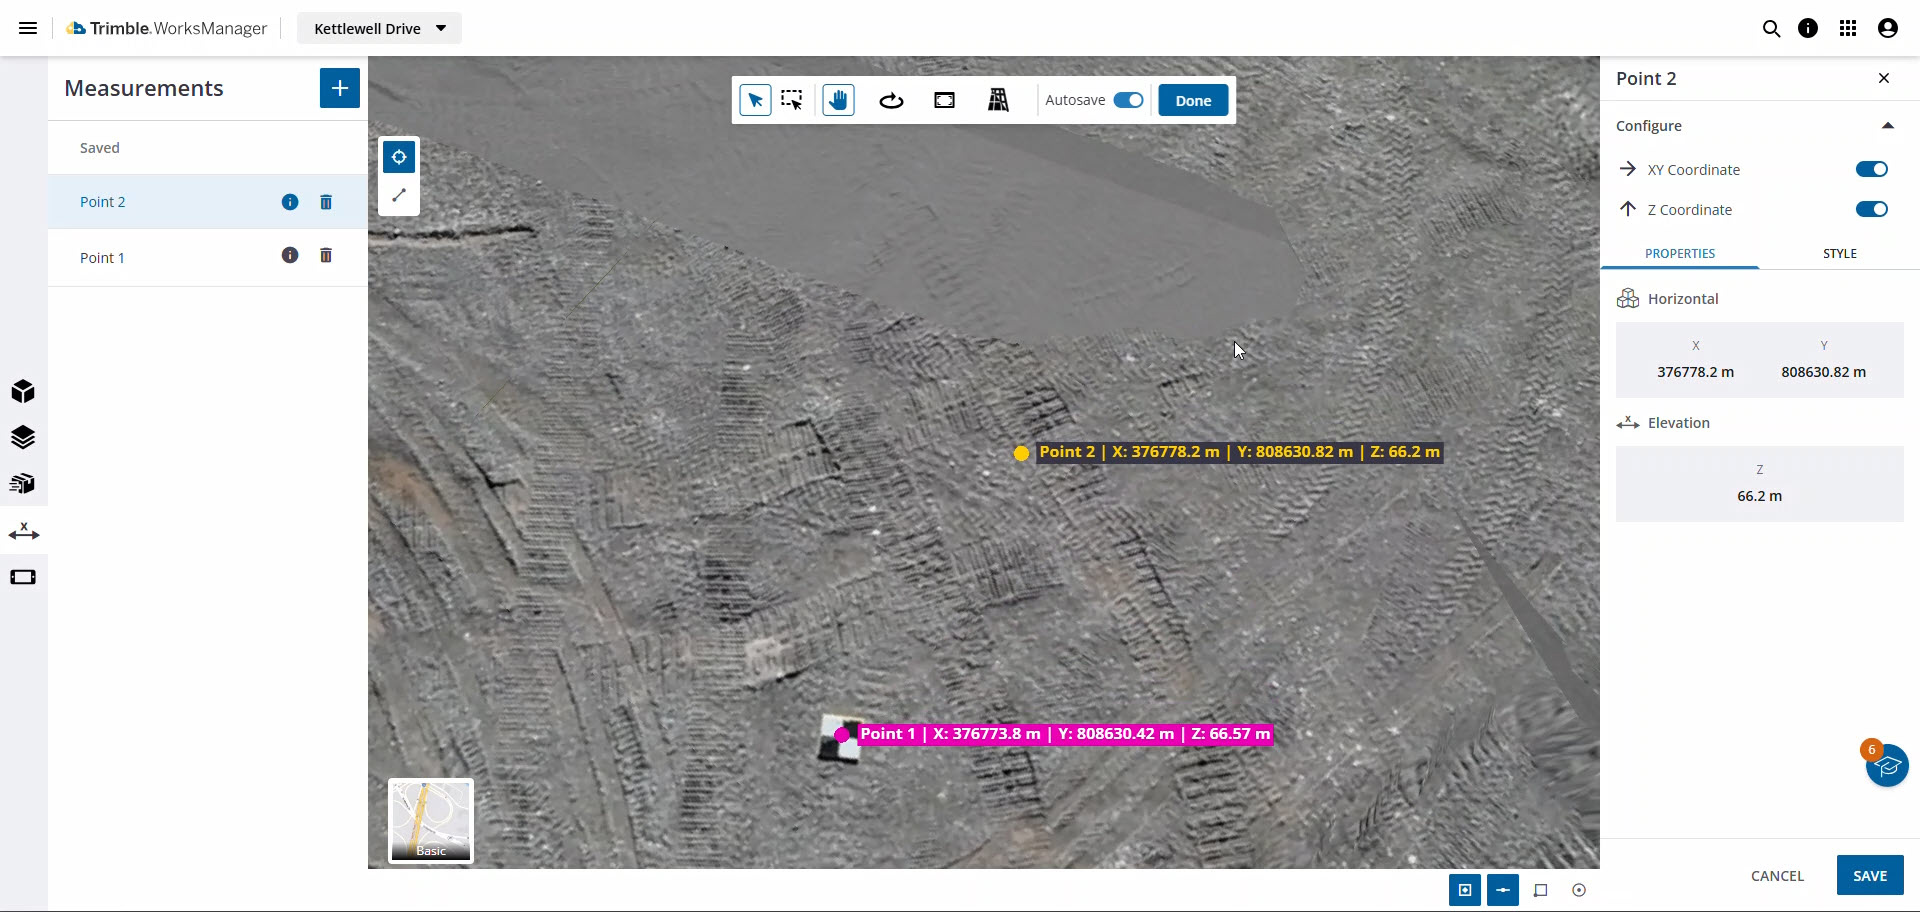
 Point measurement - Pick a location in the view to see the XY coordinate and the Z coordinate label next to the auto-incremented point measurement name in the view. Accurately capture and display coordinates (e.g., northing, easting) and elevation (Z value) for any selected point on a 3D surface or other model data. Capture precise coordinates simply by clicking a location; the X, Y, and Z data instantly appears in the Properties pane on the right.
 -
 Polyline measurement - Pick two or more locations in the view to see the values of each segment in the view. Accurately measure various parameters like 3D distance, horizontal distance, slope distance, and angle measurements within the 3D model.
 -
Area Measurements - You can calculate the 2D planimetric area and perimeter of a specific site zone by drawing a closed polygon on the 3D surface. Then visualize the area in the 3D viewer, so you can estimate material needs (like seed or pavement), track progress, and define boundaries for volumetric analysis, without switching to complex drafting software.
NOTE: Polygons you draw for area calculations can be saved and reused as selectable boundaries to constrain volumetric calculations. -
 Angle Measurements - You can make angle measurements in the 3D Viewer. These measurements are stored with your other measurements so your colleagues can reference them.
 -
 Volume measurement - Make volume calculations between two surfaces. Select "From" and "To" surfaces (e.g., latest survey vs. design) and define an optional boundary to get a summary of the area, volume, cut, fill, and balance values.
 -
-
-
Measure grade/slope along a path - Measure and visualize grades and slopes along polylines in 3D. This allows you to obtain gradient measurements in units like percent, degrees, or ratio, displaying this information directly in the view or the Info pane for each individual segment of a polyline.
-
Measure vertical distances - Determine the vertical elevation difference for each individual segment of a polyline.
-
Save measurements - Each measurement appears in a list, allowing for future reference.
-
Use snap modes - To ensure your measurements are accurate, use the snap toggles at the bottom of the screen to lock your cursor to faces, lines, points, or the centers of circles.
Using the Autosave toggle, your measurements are automatically saved to the list on the left. These saved measurements are persistent, meaning they remain even after you refresh your browser.
The most significant benefit is collaboration. Because these measurements are saved and visible to other users, you can create a measurement, save it, and then communicate with a colleague about that specific data point. It removes ambiguity, improves communication, and ensures everyone on the project is looking at the same information in the same 3D context.
Prerequisites
-
WorksManager Pro license
-
Project data
For area and volume calculations:
-
The project must be a new Connected Project.
-
Calculations can be completed on imported TTM surfaces and surveyed surfaces in the project.
Calculate the Coordinates at a Point
-
On the left side, click the
 3D Viewer icon.
 -
Click the
 Measure icon on the toolbar near the top of the view.
 -
Click the
 Point measurement icon to the left.
 -
Pick a location in the view to see the XY coordinate and the Z coordinate in the pane on the right. To see a label next to the auto-incremented point measurement name in the view, toggle the values on/off separately on the Properties tab.
-
Click the
 Measurements icon on the left to open the Measurements pane where you can see the saved measurements, and also:
-
Click the
 Visibility icon to show/hide the measurements.
 -
Click the
 Info icon to center the measurement in the view and see its properties in the pane on the right, or
 -
Click the
 Trash icon to delete it.
 -
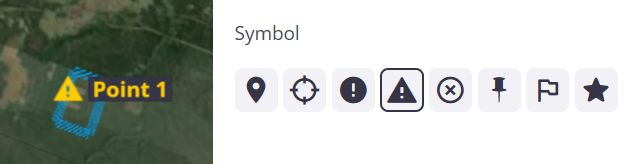
Click the Style tab to edit the label and dot Color. Click the colored dot to access the palette where you can choose the color. You can also change the point measurement’s Symbol below.
-
Click Done.
Calculate a Linear Distance/Polyline Length
-
On the left side, click the
3D Viewer icon. -
Click the
Measure icon on the toolbar near the top of the view. -
Click the
Polyline measurement icon. -
Pick two or more locations in the view to see the values of each segment in the view.
-
Double-click the final point of the polyline to save the measurement.
-
Click the
 Measurements icon on the left side to open the Measurements pane where you can see the saved measurements, and also:
-
Click the
Visibility icon to show/hide the measurements. -
Click the
Info icon to center the measurement in the view and see its properties in the pane on the right, or -
Click the
Trash icon to delete it. -
Click the Style tab to edit the label and dot Color. Click the colored dot to access the palette where you can choose the color.
-
-
With a measurement selected, you can toggle these on/off on the Properties tab on the right:
-
3D Distance - Also referred to as "Total" or simply "Distance," this value represents the direct linear length of a segment between selected points in 3D space.
-
2D Horizontal - Referred to as "2D" or "Horizontal," this value corresponds to the distance between points as projected onto a flat, horizontal plane, excluding elevation changes.
-
Vertical - This value reports the vertical difference (elevation change) between the start and end points of the measurement.
-
Slope and Grade - This value indicates the steepness or incline of the measured line. It enables users, such as foremen, to analyze terrain for site safety, haul truck operations, and adherence to design specifications. Visual representations of this feature show it can include angular measurements (radians) or percentage grades (e.g., -50%).
-
To exit the measurement mode, click Done and toggle the
and/oricon off.
See the Slope/Grade of a Linear Measurement
-
Pick any linear measurement in the view or select it in the Measurements pane and click the
 Info icon.
 -
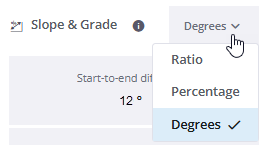
Review the Slope & Grade section at the bottom of the Properties pane.
-
Click the drop-down arrow to switch the display of values between Ratio, Percentage, and Degrees.
Edit Point Measurements
You can click an existing point or the vertex of a line to edit it; the point/vertex turns yellow when selected for movement.
-
Pick any point measurement in the view.
-
Drag-and-drop it to update its location and coordinates.
-
In the Properties pane on the right, click the Style tab.
-
Select a new color or symbol for the marker in the view.
-
Click Done.
Measure Vertical Distances
-
Make a linear measurement using the steps above.
-
Pick the linear measurement in the view or select it in the Measurements pane and click the
 Info icon.
 -
Review the Vertical Delta section in the Properties pane.
Measure 2D Areas
Create a polygon to obtain area and perimeter calculations. Calculate the 2D planimetric area and perimeter of a specific site zone by drawing a closed polygon on the 3D surface. These drawn polygons can be styled, saved, and reused as selectable boundaries to constrain volumetric calculations.
-
Click the
Measure icon on the toolbar near the top of the view. -
Click the
 Toggle Polygon Measurement icon.
 -
Pick three or more vertex locations in the view.
-
Double-click the last vertex to close the polygon.
-
Review the polygon's area and perimeter in the pane on the right.
-
Click the Style tab to specify the Fill Color and Transparency of the area, as well as the Style (solid, dashed, or dotted) and Weight of the area boundary's Stroke (line).
-
Click Done to close the pane. Your measurement is saved in the Measurements pane (if you have Autosave toggled).
Measure Angles
-
Click the
Measure icon on the toolbar near the top of the view. -
Click the
Angle Measurement icon. -
Click two point to specify the first bearing.
-
Click a third point to specify the second bearing based on the first point you clicked.
-
Review the angle between the two bearings in the pane on the right.
Measure Volumes between Surfaces
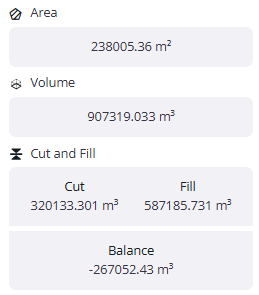
The tool compares two surfaces: a surveyed surface (as the reference) and a design surface (as the target) to perform a detailed volumetric analysis. Calculations include:
-
The area overlapping between the two surfaces.
-
The total volume as the sum of the absolute cut and fill.
-
Separate cut and fill volumes.
-
The overall balance value between the cut and fill of the site.
Volume calculations can be edited, e.g., renamed, like the other types of calculations. You can also define a specific area by drawing a custom boundary (polygon; see above) for targeted calculations.
-
When creating a volumetric measurement, you can see the cut/fill heatmap with a color legend. The color gradient is a fixed value.
-
Click the
Measurements icon on the top toolbar. -
Click the
Create Volumetric Measurement icon. -
In the right pane, click the
 Edit icon at the top and enter a name for the measurement.
 -
Confirm the volume Calculation Type.
-
Surface to Surface (TIN)- This tool calculates the volume between two overlapping surfaces (such as comparing a recent drone survey to the final design or a previous survey). Users can optionally draw a boundary, and the system outputs the Cut Volume, Fill Volume, Balance Volume (Cut minus Fill), and the corresponding area.
-
-
Click in the From Surface field and select a surface or click the
 icon and pick it in the view.
 -
Do the same for the To Surface.
-
Click the
icon and pick a volume calculation boundary in the view. Alternately, click the  Draw Boundary icon and click three or more locations in the view. Double-click the last vertex to close the boundary in the view.
 -
Click Compute.
-
Review the Area, Volume, and Cut and Fill values, as well as the heatmap and legend.
-
Click Save or Cancel when you are finished.
-
To revisit a volume calculation, select it in the Measurements pane and click the
Info icon. -
Review the heatmap and the colored volume legend. With only Viewer role permissions, you can select a volume calculation and see the heatmap colors and legend. You can toggle heat maps on/off.
Create Long Sections
See Work with Trajectories and Alignments
Pick Precisely with Snap Modes
 When in measurement mode, toggle one or more icons to enter snap modes:
-
 Snap to faces - A snap indicator appears on the nearest face, letting you pick it precisely.
-
 Snap to lines - A snap indicator appears on the nearest line or polyline, letting you pick it precisely.
 -
 Snap to points - A snap indicator appears on the nearest point, letting you pick it precisely.
 -
 Snap to center - A snap indicator appears at the centroid of the nearest shape, letting you pick it precisely.
Save and Review Measurements
-
Toggle Autosave on the toolbar near the top of the view.
or
-
Click Save at the bottom of the Properties pane.
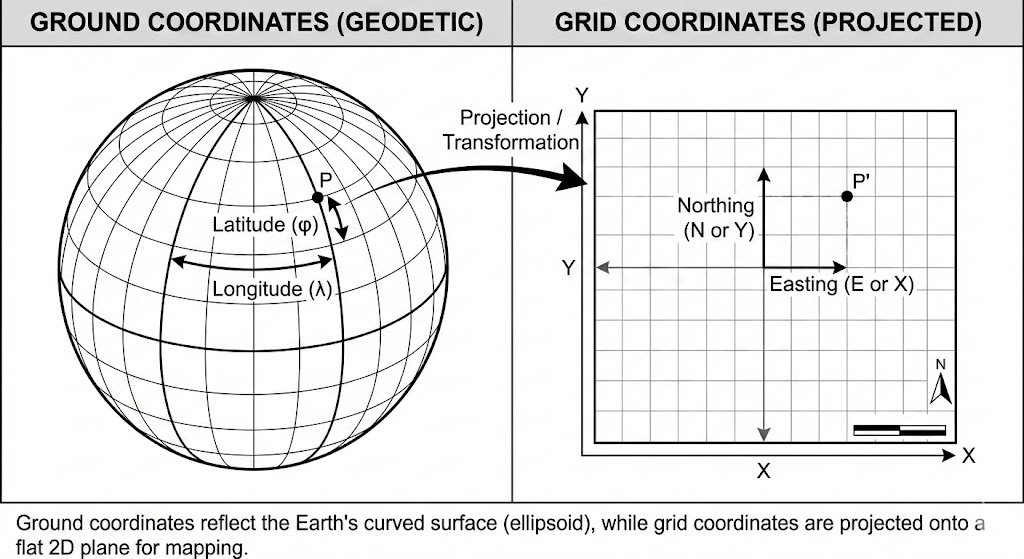
Ground versus Grid Coordinate Measurements
Ground and grid coordinates differ: ground coordinates represent distances on the Earth's curved surface, while grid coordinates are flat, projected versions of the same. Ground coordinates are used for real-world, localized projects like surveying and construction where precise, non-distorted measurements are crucial. Grid coordinates are derived from a mathematical projection (like UTM or State Plane) and are often used for large-scale planning and GIS, but they introduce distortion and have lengths different from measurements based on ground coordinates.
How WorksManager Calculates Measurements
All displayed measurements represent grid distances. If your project is using a published coordinate system, be aware that these values may differ slightly from actual ground distances, as the system assumes that the measurement elevation aligns with the origin of the local coordinate system. However, if you are using a local calibrated file, a scale factor is automatically applied so that the grid distance closely approximates the ground distance.
