Interference detection
See also: About the spectrum analyzer and Spectrum Analyzer.
GNSS users and developers face the challenge of unwanted signals interfering with the low-power signals transmitted from satellites. This can disrupt productivity or slow down the development of new products. With the Maxwell 7 technology, Trimble has added the ability to monitor and analyze the signals received in each of the GNSS frequency bands using the receiver's web interface. This topic provides an overview of how this onboard spectrum analyzer feature can help identify interference on the bench or post-mission and take steps to remove it.
Interference sourcing
There are a variety of potential sources of interference:
-
Integration issues
-
Faulty equipment
-
Legal transmissions in GNSS bands
-
Malicious interference
Spectrum analyzer features
The spectrum analyzer feature embedded in the web user interface of the Trimble precision receivers replicates many of the traditional features found in benchtop analyzers. However, unlike the traditional analyzer, you can now view the spectrum as seen by the receiver. The envisioned user of this feature is an engineer integrating a Trimble Maxwell™ 7 receiver into an application. Often users have integration challenges, such as poorly shielded processor boards or cable assemblies, that can radiate enough energy into the antenna that results in significant jamming in the GNSS bands. A sampling (~1% of all total samples) of the digital measurements used by the Maxwell 7 ASIC are used to produce the analyzer display. It is this technique of using only a subset of the sampled data that allows the receiver to maintain normal operation while simultaneously performing the spectrum analyzer function. The main features are:
-
Ability to monitor all GNSS and MSS bands
-
Monitors continuously in the background
-
Playback of previous days’ data in waterfall or filtered format
-
Display real-time data in waterfall, filtered, peak hold, or unfiltered formats
-
No affect on current receiver functions such as position output, corrections generation, or observables streaming
A closer look at the displays available:
Spectrum Analyzer view
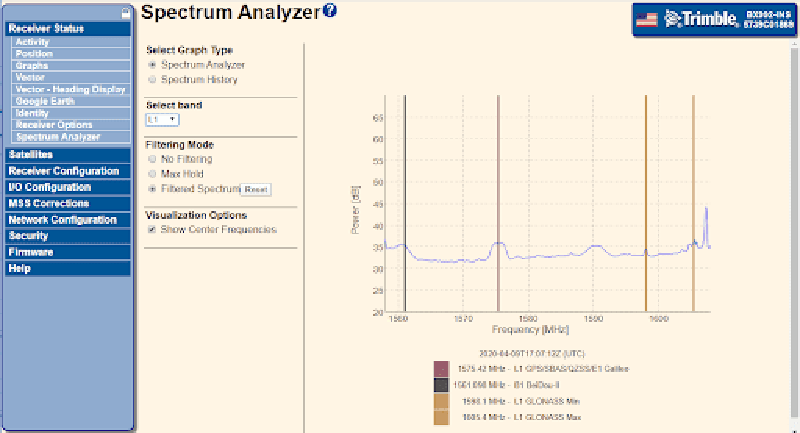
This display shows an amplitude-versus-frequency (in dB). You can select each of the frequency bands supported by the receiver to view the spectrum. This includes the MSS band used for RTX or OmniSTAR data. The GNSS bands are all 50 MHz wide while the MSS band is 50 KHz wide.
Three different selections are available to filter the data. With No Filtering mode, the spectrum analyzer passes the raw data sampled directly to the display. This is useful for attempting to catch transient type signals such as radars.
The Max Hold mode also uses the unfiltered dataset but displays the maximum value for each frequency. This is again useful to catch transient type signals but cannot measure the duration or repetition rate of the transient signals. The Filtered Spectrum setting uses low pass data-filtering to filter the data displayed. The GNSS center (Min/Max for GLONASS) frequencies can be superimposed on the display. This allows an easy visualization of where we may expect to see energy from the GNSS satellites and how close an interference source may be.
Spectrum History view
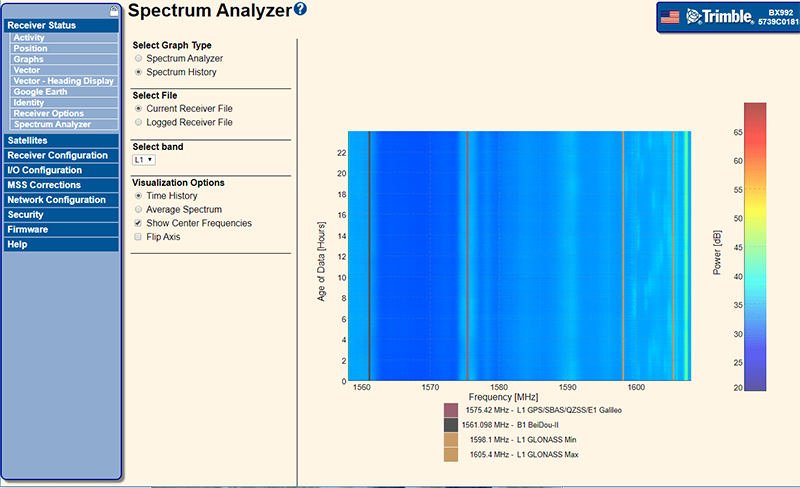
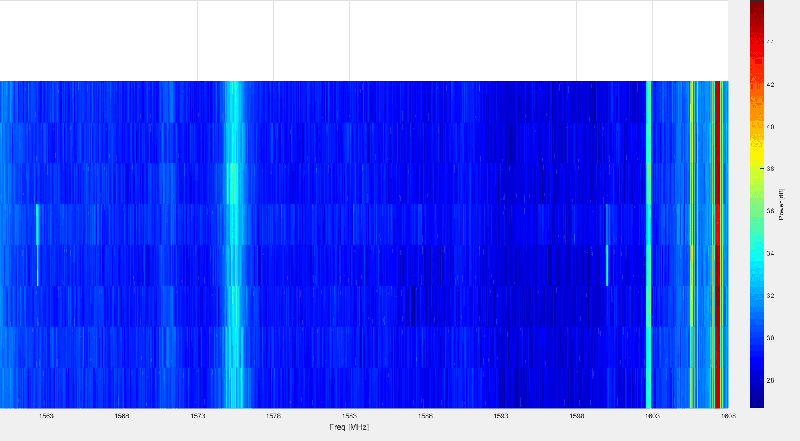
This display shows a time-versus-frequency in waterfall format. Amplitude or power of the signal is presented as colors. The axis can be flipped so that the frequency is on the Y axis and time is on the X axis. The display allows one to look at each band for the last 24 hours and identify consistent or temporary power at a particular frequency.
It is also possible to view previous days data by selecting Logged Receiver File. Both views allow the following mouse control manipulations:
-
Precise readout of signal level, frequency and time via mouse hovering
-
Frequency axis magnification
-
Amplitude axis magnification
-
Time axis magnification
In this example, the DME transmitters are not causing any major problems to L5 tracking, however, this may not always be the case where frequencies are closer to the GNSS frequency. It should be noted that the minimum expected reception level at earth’s surface for GNSS satellites is below the ambient noise floor, which means that GNSS signals will not always be visible on a spectrum analyzer.
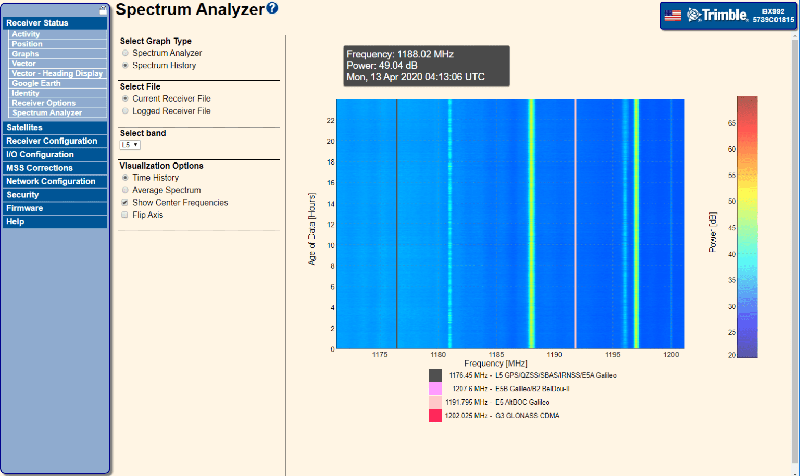
This reasoning holds generally only for individual satellites. Multiple satellites using the same bandwidth has the effect of raising the noise floor in the same geometry as the signal envelope of that particular bandwidth. If enough satellites are present, this envelope will rise out of the noise.
Onboard interference
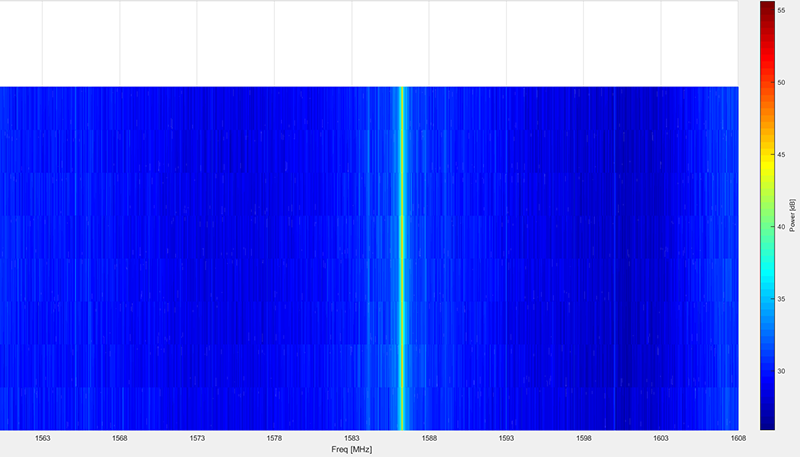
It is common for vehicle applications to have a multitude of processors, sensors (i.e., cameras and LiDAR) and cabling integrated on the same platform. Interference problems often only occur when all pieces of the system are in place and powered up. Finding the source of this self generated RF can incur significant delays during a project.
The onboard spectrum analyzer can help significantly speed up this task. In the following, example poor positioning performance from a vehicle navigation system prompted a closer look at the signal tracking and spectrum analyzer.
For a typical installation we would expect to see the maximum C/No for L1 to be over 50 dBHz. However, the values were never over 45 dBHz and when we look at the L1 spectrum below we notice a significant signal present at around 1587 MHz. It is so strong that the RF has saturated the GPS spectrum at 1575.42 MHz.
When we power down some of the sensors on the vehicle in the plot below, the 1587 MHz signal disappears and the GPS L1 signal appears above the noise floor. Therefore, while it is likely that the jammer is at approximately 1587 MHz more generally the signal could actually be a harmonic at 1587 +/- N x 50 MHz with reducing probability as N increases.
Conclusions
As the wireless spectrum gets increasingly crowded and autonomous systems add more sensors, thee will be an increase in the amount of interference in the GNSS RF bands. The spectrum analyzer feature of Maxwell 7 technology is intended to be a critical tool in the toolbox of developers releasing products to market within specification and on schedule. Since its introduction we have successfully troubleshooted many problematic installations where pinpointing interference in the past would have been difficult.