Monitor Tunnel Convergence Points
Use the Assign Tunnel Convergence Points command along with the Trimble Monitoring Cloud service to monitor tunnel convergence points by storing and comparing coordinates for tunnel points that have been measured in the field on multiple occasions. The cumulative data tracks movement over time resulting from tunnel deformation, which can be viewed in graphic and tabular views using the Convergence Points tab in the Tunnel View or in the customizable Tunnel Convergence Report.
This topic includes the following sections:
- Create a TBC project for the first (reference) epoch - The reference epoch is required to establish a baseline of convergence point coordinates to which coordinates computed in subsequent epochs are compared to show point displacement.
- Create a TBC project for each subsequent epoch - Each subsequent epoch in your Trimble Connect monitoring project will compare that epoch's convergence point coordinates with coordinates in the reference epoch and other previous epochs in the monitoring project to show point displacement over time.
- Set Warning and Alarm thresholds for monitored points - Specify displacement threshold values that, if exceeded, will result in displacement vector arrows displayed in graphic views to display in yellow (point displacement exceeds one or more Warning thresholds) or red (point displacement exceeds one or more Alarm thresholds).
- View convergence point displacement - View convergence point displacement information in any of the following views:
Prerequisites:
Licensed module. See the Subscription Plans page. For a license matrix by command, see the License page in the TBC Community. Also see View and manage licensed features. In addition, to use the tunnel monitoring features, you must have a Monitoring module license.
Create a TBC project for the first (reference) epoch:
The reference epoch is required to establish a baseline of convergence point coordinates to which coordinates computed in subsequent epochs are compared to show point displacement over time.
- Create and save a new TBC project into which you will import the tunnel design and convergence points you want to monitor for changes.
Each new VCE project you create for point monitoring is represented by an epoch in the monitoring project. Each epoch includes the point coordinates and a time stamp indicating when the data was collected.
Tip: Include the date for the current data epoch in the VCE project name to more easily manage the collection of TBC project files used for monitoring.
- Import the TXL (.txl) file containing the tunnel design for which you want to monitor convergence points.
- Import the convergence point data for the first epoch. Then, process and adjust the data as applicable using the various commands in the Survey ribbon tab.
- Select Assign Tunnel Convergence Points in Tunnels > Reports.
The Assign Monitoring Project message window displays. Before you can assign tunnel convergence points, you must create the Trimble Connect project in which convergence points from this and all subsequent epochs will be synchronized and stored.
- In the Assign Monitoring Project message window, click Yes to display the Assign Monitoring Project command pane.
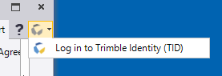
If you have not already done so, when prompted,
 log in with your Trimble Identity login credentials so that TBC has access to the Trimble Connect cloud.
 - In the Assign Monitoring Project command pane, create the new Trimble Connect project on the cloud as follows:
- In the Monitoring project drop-down list, select Create new project.
- In the New project name field, enter a name for the new monitoring project that will be stored on the Trimble Connect cloud.
- Click the Create Project button
The new project name is displayed in the Monitoring project drop-down list.
- In the Monitoring epoch date/time field, enter the date and time the point measurements were made in the field to assign to the new epoch in the monitoring project.
- Click the Save button.
The Assign Monitoring Project command pane closes and your TBC project is synchronized with the new monitoring project on the Trimble Connect cloud.
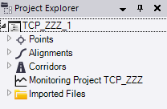
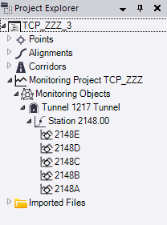
When synchronization is complete, a new Monitoring Project parent node displays in the Project Explorer.
- In the Assign Tunnel Convergence Points command pane, select the tunnel to which you want to assign convergence points in the Tunnel drop-down list.
- Select the appropriate Selection Method for selecting convergence points:
- Specific station - Enter the station or select it in a graphic view.
- Station interval - Enter or select in a graphic view the Begin/End station and the Station interval from which you want to select points. Also, enter a Search distance in which to search for points in either direction of the selected station. Optionally, check any of the check boxes to include points at the specified station type.
- Click in the Points field and then use a graphic view or the Project Explorer to select the convergence points (use Shift + click or Ctrl + click) you want to monitor at the specified station or station interval.
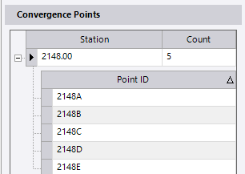
- Click the Add button to display the selected station(s) and points in the Convergence Point list.
Note: You can right-click any point displayed in the Convergence Point list to select to delete it from the list.
- Click Apply (keeps command pane open) or OK (closes command pane) to run the command.
- When prompted to save the project before continuing, click Yes.
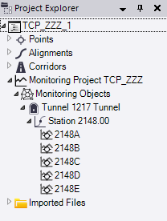
The synchronization process begins immediately. During synchronization, the convergence points are transferred to the Trimble cloud where they are added as a new epoch to the Trimble Connect monitoring project. In addition, the tunnel node, station node(s), and convergence point nodes are added as child nodes to the parent Monitoring Project parent node in the Project Explorer. All of the monitoring nodes are red during synchronization and change to black when synchronization is complete.
You are now ready to create a project for each subsequent epoch, as data becomes available, so that movement of the convergence points can be tracked over time.
Create a TBC project for each subsequent epoch and synchronize data:
Each subsequent epoch in your Trimble Connect tunnel monitoring project will compare that epoch's convergence point coordinates with convergence point coordinates in the reference epoch and other previous epochs in the monitoring project to show point displacement over time.
- Create a new TBC project into which you will import the points you want to monitor for coordinate changes.
Each new VCE you create for point monitoring is represented by an epoch in the Trimble Connect monitoring project. Each epoch includes the point coordinates and time stamp.
Tip: Include the date for the current data epoch in the VCE project name to more easily manage the collection of TBC project files used for monitoring.
- Import the TXL (.txl) file containing the tunnel design for which you want to monitor convergence points.
- Import the convergence point data for the subsequent epoch. Then, process and adjust the data as applicable using the various commands in the Survey ribbon tab.
Note: It is important that the names of the points being monitored do not change from epoch to epoch.
- Select Assign Tunnel Convergence Point in Tunnels > Reports.
- In the Assign Monitoring Project message window, click Yes to display the Assign Monitoring Project command pane.
If you have not already done so, when prompted, log in with your Trimble Identity login credentials so that TBC has access to the Trimble Connect cloud, where convergence point data will be stored and synchronized.
- In the Assign Monitoring Project command pane, do the following:
- In the Monitoring project drop-down list, select the Trimble Connect monitoring project to which you want to synchronize convergence points (that is, the project containing previous epochs).
- In the Monitoring epoch date/time field, enter the date and time the point measurements were made in the field to assign to the new epoch in the monitoring project.
- Click the Save button.
A new Monitoring Project parent node displays in the Project Explorer. Nested beneath it are nodes representing each of the convergence points downloaded from the Trimble Connect monitoring project.
In the Assign Tunnel Convergence Points command pane, the convergence points created for the prior epoch are automatically selected; however, you can change the selection if necessary.
- Optionally, add convergence points to the Convergence Points list as described in Create a TBC project for the first (reference) epoch. Or, right-click any point in the Convergence Points list and select Delete to remove it from the list.
Note that if you add a new point, it must be included in at least two synchronized epochs before it will show point movement in the various monitoring views and reports.
- In the Assign Tunnel Convergence Points command pane, click Apply (keeps command pane open) or OK (closes command pane) to run the command.
- When prompted to save the project before continuing, click Yes.
The synchronization process begins immediately. During synchronization, the convergence points are transferred to the Trimble cloud where they are added as a new epoch to the Trimble Connect monitoring project. After synchronization, the parent monitoring nodes, which are red during synchronization, change to black.
- Repeat this procedure as necessary to add more epochs to the monitoring project as data becomes available.
After creating TBC projects for two or more epochs, you can view displacement information for the selected convergence points as described in the following sections of this topic:
- "View tunnel convergence: Plan View and 3D View"
- "View tunnel convergence: Tunnel View"
- "View tunnel convergence: Tunnel Convergence Report"
But before you do, you might want to change Warning and/or Alarm thresholds for one or more of the convergence points as described in the next section: "Set Warning and Alarm thresholds for convergence points".
Set Warning and Alarm thresholds for convergence points:
Specify Warning and more severe Alarm threshold values for station, offset, and vertical values that, if exceeded, will result in color coding being applied to convergence point displacement vector arrows displayed in graphic views. A yellow displacement vector arrow indicates that the point displacement exceeds one or more Warning thresholds, but does not exceed any Alarm thresholds. A red displacement vector arrow indicates that the point displacement exceeds one or more Alarm thresholds.
To set Warning and Alarm thresholds, do either of the following in the latest epoch project:
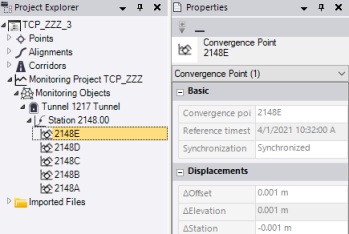
- In the Project Explorer, select one or more convergence points whose thresholds you want to edit and select Properties to display the Properties pane. Then, edit any of the Warning Thresholds (less severe) and Alarm Thresholds (more severe).
- Display in the Tunnel View one or more convergence points whose thresholds you want to edit as described in "View tunnel convergence: Tunnel View". Then, edit any of the Warning Thresholds (less severe) and Alarm Thresholds (more severe) displayed on the Convergence tab in the Tunnel View as applicable.
View tunnel convergence: Plan View and 3D View
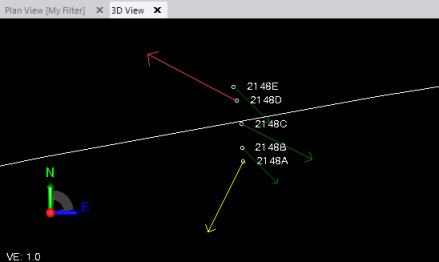
Select the Plan View tab or 3D View tab to view vector arrows indicating the direction and relative distance of point displacement when compared to the reference epoch.
Displacement vector arrows are colored as follows:
- Green = The point displacement is within Warning/Alarm thresholds.
- Yellow = The point displacement exceeds one or more Warning thresholds, but does not exceed any Alarm thresholds.
- Red = The point displacement exceeds one or more Alarm thresholds.
Note: If displacement vector arrows are too small or too long to view easily, you can adjust the arrow size using the the View > Monitoring > Maximum displacement arrow length on screen setting in the Project Settings dialog.
View tunnel convergence: Tunnel View
Use the Tunnel View command to view the delta displacements and warning and alarm thresholds set for each convergence point in your project, similar to the information displayed in the Tunnel Convergence Report.
- Do either of the following to open the Tunnel View tab:
- In the Project Explorer, right-click the tunnel you want to view and select Tunnel View.
- Select Tunnel View in Tunnels > View to display the Tunnel View tab. Then, in the Tunnel drop-down list located in the lower-left corner of the tab, select the tunnel you want to view.
- In the Shape drop-down list located on the lower-left side of the Tunnel View tab, select the shape to which the convergence points are assigned.
- Select the Convergence sub-tab located on the left side of the Tunnel View tab.
Since convergence points may be located anywhere along the tunnel's length, it would be easy to miss them using the navigation slider control or station selection buttons located at the bottom of the tab.
- To select a station at which convergence points are assigned, do either of the following:
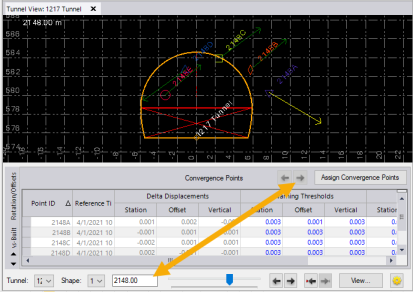
- Enter the station in the Station field located at the bottom of the tab.
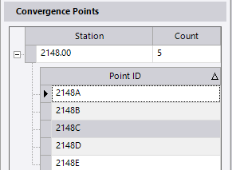
- Use the two Convergence Points Station arrow buttons located above the table view (see image below) to move to the next or previous station to which as-built points have been assigned.
The selected tunnel design shape for the selected station displays in the graphic view, along with assigned convergence points. Read-only displacement data for each convergence point is displayed in the table. Arrows display in the graphic view to visually show displacement of points.
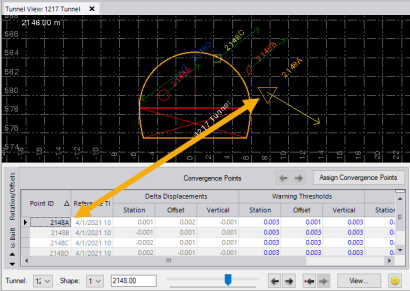
As in the Plan View and the 3D View, dsplacement vector arrows are colored as follows:
- Green = The point displacement is within Warning/Alarm thresholds.
- Yellow = The point displacement exceeds one or more Warning thresholds, but does not exceed any Alarm thresholds.
- Red = The point displacement exceeds one or more Alarm thresholds.
If you select a point in the table, the point is highlighted in the graphic view, and vice versa.
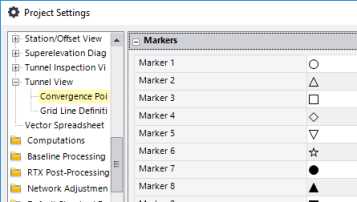
Note that each convergence point is assigned a unique marker shape and color in the graphic view. You can use use the Tunnel View section in the Project Settings dialog to change default markers and colors used for convergence points. See step 6.
- Optionally, do either of the following:
- To remove a convergence point, select its row in the Convergence Points table, right-click, and select Delete.
- To assign additional convergence points, click the Assign Convergence Points button.
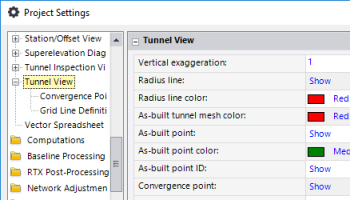
- To view and, if necessary, change Project Settings that determine the display of convergence points in the Tunnel View, click the Project Settings button
 located in the lower-right corner of the Tunnel View tab to display the Tunnel View pane in the Project Settings dialog.
In the Project Settings dialog, click any of the settings to see a description of its function. See View Settings for additional instructions.
View tunnel convergence: Tunnel Convergence Report
- In the TBC project with the latest synchronized epoch data, select Tunnel Convergence Report in Tunnels > Reports to display the Tunnel Convergence Report command pane.
Optionally, you can create a new project and synchronize with the Trimble Connect tunnel monitoring project as described in "Create a TBC project for each subsequent epoch and synchronize data". Then use the following instructions to generate a new report.
- In the Tunnel Convergence Report command pane, do the following:
- In the Report template drop-down list, select Tunnel Convergence Report.
- Select the Tunnel and Tunnel shape(s) on which you want to report.
Convergence points are already selected.
- Optionally, change the Begin station and End station.
- Optionally, check the Specify time period check box and enter a Start date and End date during which you want to view convergence data.
- Optionally change the Vertical exaggeration (vertical scale) as necessary to better see vertical differences in the point movement.
- Select the appropriate Image Scaling and Chart Scaling options to specify whether to use the same scale for all images and charts in the report or to use the best-fit scale for each image and chart.
- Click Apply (keeps command pane open) or OK (closes command pane) to run the report.
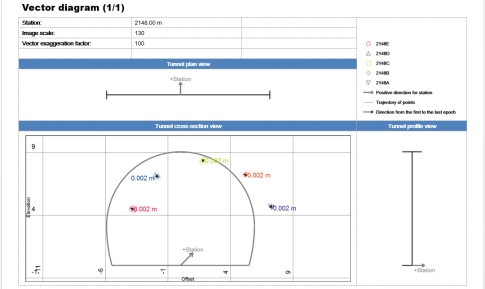
The Tunnel Convergence Report opens in MS Word.
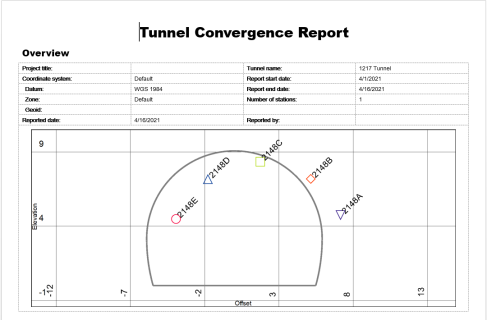
You can view any of the helpful tables, charts, and images in the report to assess point convergence. Following are some examples.
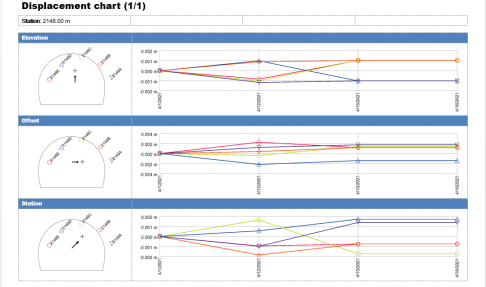
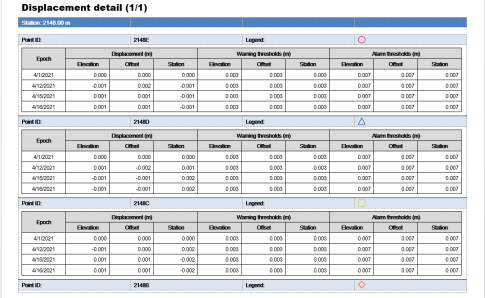
For instructions on editing this custom report to better suit your needs, see Create and Edit Customized Report Templates.
