View Settings
Settings are available for the various types of graphic, spreadsheet, and other views in which your project data is displayed. Use view settings to:
- Choose the input method for horizontal and vertical alignment segments
- Control graphic view display characteristics, such as plot scales and vertical exaggeration
- Control annotation text, and gridline intervals, colors and line styles in views
Note: Select Toggle Gridlines in the Status Bar to turn gridlines on and off.
- Show and hide individual columns for data on spreadsheet views
- Set the default view filter used when you open new graphic views
Note: If you delete a view filter that you have set as the default, the Default View Filter will revert to the All view filter, which cannot be deleted.
Tip: If your project has a lot of data, you may want to select a default view filter other than All so that graphic views refresh more quickly.
To access the settings:
- Select Project Settings in the Quick Access Toolbar.
The Project Settings dialog displays.
- Click View in the left pane.
- Click any of the view types to display and edit individual settings.
|
View Settings |
|
|
3D Drive View |
|
| Alignment viewpoint height |
Enter the height of the viewpoint above or below an alignment The direction of the view from this height can be adjusted in the view. Tip: If you label an alignment and want to see the labels from a "bird's-eye" view, set the 3D Drive's viewpoint height to, for example, 30 meters and point the view down onto the alignment. |
| Show alignment statistics |
Select Yes to show information about the alignment's geometry at the vehicle's current location, including station, coordinate, elevation, and slope values. |
| Use third-person view of vehicle |
Select Yes to specify that the camera view be looking toward the rear of the vehicle when driving along a surface. |
| Third-person surface viewpoint height |
Enter the height of the viewpoint above or below a surface. |
| Third-person viewpoint distance behind vehicle |
Enter the distance behind the vehicle for a third-person viewpoint looking toward the rear of the vehicle when driving along a surface. |
| Show surface statistics |
Select Yes to show information about the surface's geometry at the vehicle's current location, including coordinate, elevation, slope, and, if a reference surface is selected, cut/fill values. |
| Vehicle type |
Select a vehicle image to display in the 3D Drive View. Note: Image information for each vehicle displayed in the list is contained in a paired Sketchup file (.skp) and XML file stored in C:\ProgramData\Trimble\Vehicles. If you add a Sketchup file and corresponding XML file PNG file for a new vehicle to the Vehicle folder, it will display in the list. In addition, you can customize any vehicle model in the folder to, for example, add your company logo to the vehicle. |
| Background color |
Select the color to apply to the background in the view. |
|
Alignment Editor |
|
| Horizontal alignment options |
Select options for the values you want to use to define horizontal alignment segments.
These settings are essential when you create and edit horizontal alignments. |
| Vertical alignment options |
Select options for the values you want to use to define vertical alignment segments.
These settings are essential when you create and edit a vertical alignment. |
| Miscellaneous |
Select whether to show or hide columns in the Alignment Editor that are empty. |
|
Corridor Mass Haul Diagram |
|
| Display type |
Select an option for gridlines in the Corridor Mass Haul Diagram. If you select Fixed number of grid lines or Grid interval, see below. These settings are essential when you perform mass haul calculations for a corridor and then analyze a Corridor Mass Haul Diagram. |
| Grid interval separation |
If you selected Grid interval above, enter the fixed distance you want between gridlines in the diagram. |
| Fixed grid line count |
If you selected Fixed number of grid lines above, enter the total number of gridlines you want in the diagram. |
| Annotation text |
Select Yes to label the gridlines in the diagram. |
| Scale bar |
Select an option for the scalebar to show in the diagram:
|
| Colors |
Select a color for each mass ordinate shown in the diagram. For descriptions of the ordinates, see View and Interpret a Corridor Mass Haul Diagram. |
| Drafting |
Adjust the Plot scale and Vertical exaggeration in the Corridor Mass Haul Diagram. |
|
Corridor Template View |
|
| Plot scale |
Enter a plot scale for the Corridor Template View. These settings are essential when you create and edit corridor templates and their instructions, and when you create tunnels and view them in the Corridor Template View. |
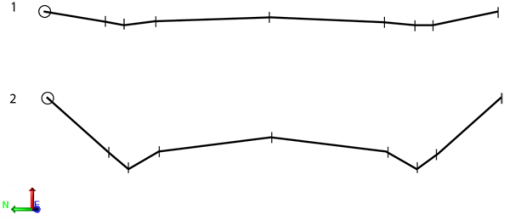
| Vertical exaggeration |
Enter a vertical exaggeration (VE) for the view. Increasing the VE can make it easier to check your data.
Figure: Vertical exaggeration Tip: You can also change the exaggeration while in the view by pressing [Ctrl] + [Shift] and rolling the mouse wheel. |
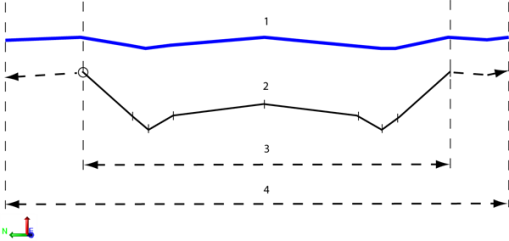
| Left/right extension |
Enter lateral limits for corridor templates.
Figure: Left/right corridor template extension By default, a corridor template extends to the width of the surface it is mirroring. If that surface is wider than the default limit you set here, the corridor template is limited to these default extents. This template setting can also be adjusted in the Properties pane for any cross-section of the corridor. Note: Since the alignment itself denotes a zero offset, typically the left offset value will be a negative number. This setting is essential when you create corridor templates based on the Surface instruction type. |
| Display perpendicular |
Select Yes to show corridor template geometry perpendicular to the vertical alignment; this typically applies only to tunnel geometry. |
| Shaded material |
Select whether to shade materials in material layers or to leave them transparent. |
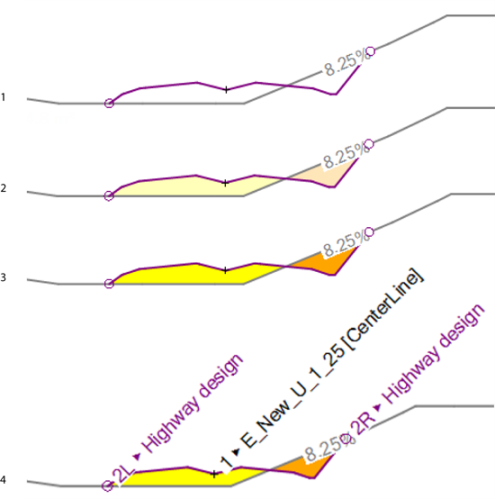
| Use opaque shading |
Select whether to use semi-transparent or opaque shading in the view.
Figure: Corridor Template View display options |
| Node labels |
Select whether to label template nodes in the view. |
| Label formatting |
Select whether to show complete label names or abbreviations for nodes in the view. |
| Include offset |
Include the offset in the node label. |
| Include elevation |
Show/hide the elevation in the node label. |
| Label rotation |
Select an alignment option for node labels in the view:
|
| Instruction slope |
Select whether to show/hide slope values for the active instruction in the view. In Project Settings > Units > Vertical Angle, you can specify whether to show slopes in % or ratio. |
|
Cross-section view |
|
| Plot scale |
Enter a plot scale for the view. These settings are important when you work in two of the program's primary vertical views, the Cross-Section View and the Stored Cross-Section Editor. |
| Vertical exaggeration |
Enter a vertical exaggeration for the view. See Vertical exaggeration in Corridor Template View above. Tip: You can also change the exaggeration while in the view by pressing [Ctrl] + [Shift] and rolling the mouse wheel. |
| Left/right extension |
See Left/right extension in Corridor Template View above. |
| Visibility column |
Select Show to display the column in which you can specify whether to hide or show segments between nodes in the Stored Cross-Section Editor. This setting is important when you edit stored cross-sections. |
|
Display options |
|
| Default view filter |
Select the view filter to apply when you create a new Plan View or 3D View; there is one exception: if you already have an active Plan View or 3D View, the view filter used in that view is used for the new view of the same type. |
| Show all lines as solid |
Select No to display imported lines using their original line styles. This setting is essential when you import CAD data. It is recommended that you leave this set to Yes to preserve system memory (lines displayed as solid line style require less processing power). |
| Line marking |
Select Show to display markers and labels for horizontal and vertical values along linestrings (in 2D views) to make viewing and editing them easier.
This setting and the ones below for line markers and line labels are essential when you toggle line marking on to help you understand and edit elements of lines. |
| Max line objects to show markers |
Sets the maximum number of line objects to show markers at one time. |
| Line markers |
Select Show to display symbols that distinguish between horizontal segment end points, arc mid points, vertical control points, and the overall line's start and end points. |
| Line labels |
Select Show to display elevation text with the visible line markers. |
|
Survey views |
|
| Feature spreadsheet |
Specify whether to show or hide the grid, global, or local coordinates for features in the Feature Spreadsheet. |
| IRI Diagram |
Set the display type, grid line count, line color and style, annotation text, and scale bar for IRI grids. |
| Monitoring |
Specify the maximum length (in pixels) of displacement vector arrows displayed in the Plan View and 3D View when monitoring point movement. Make changes if arrows are too short or too long. Also, select the color to apply to arrows indicating their displacement state: OK, Warning, or Alarm(each of which applies to a user-defined displacement threshold). See Monitor Point Movement for more information. |
| Monitoring spreadsheet |
Select to show or hide various fields/columns in the Monitoring spreadsheet. |
| Occupation spreadsheet |
Specify whether to show or hide general GNSS occupation information and antenna information in the Occupation Spreadsheet. |
| Optical spreadsheet |
Specify whether to show or hide general optical survey information, observed and computed optical data, optical station information, and target information in the Optical Spreadsheet. |
| Photo point spreadsheet |
Specify whether to show or hide photogrammetry point and observation information in the Photo Point Spreadsheet. |
|
Plan View |
|
| Contour mesh density |
These settings are important when you work in the program's default view from above, the Plan View. |
| Plot scale |
Enter a plot scale for the Plan View. This setting is essential when you add a legend to a surface or map, when you copy the Plan View to a clipboard, and when you print or plot from the view or from a plotbox. Note: The width of a legend is determined by the length of the title and the size of the text specified in the selected text style at the current plot scale. After the legend has been created, changing the plot scale does not affect the size of the legend or text, in ground units. |
| Gridline definition |
Select settings for the gridlines shown in the Plan View to help you understand a project's scale and location. |
|
Profile View |
|
| Plot scale |
Enter a plot scale for the view. These settings are important when you work in one of the program's primary vertical views, the Profile View. |
| Vertical exaggeration |
Enter a vertical exaggeration for the view. Note: By default, a vertical exaggeration of 5 is applied in the Profile View. |
|
Referenced Image |
|
| Viewing distance |
Specify the distance from a photo station to an object of interest when viewing a referenced image on the Station View tab. By specifying the correct distance to an object that is contained in adjoining images, you can align the object correctly in the images. |
| Maximum length for line-of-sight rays |
Specify the maximum length for photo station line-of-sight rays when performing photogrammetry measurements or adjusting photo stations. For best results, the line-of-sight rays should be slightly longer than the distances being measured with photogrammetry or the elevation of a UAV when adjusting aerial photo stations. |
| Show transparent images in Plan View |
Select Yes to specify that aerial images be displayed as transparent in the Plan View by default. This allows you to see information displayed beneath the image, including other overlapped images. In the Referenced Image Properties pane, you can select to override this default setting for any specific aerial image. |
| Show grayscale images in Plan View |
Select Yes to specify that aerial images be displayed in grayscale (instead of color) by default in the Plan View. This may enhance image display performance. In the Referenced Image Properties pane, you can select to override this default setting for any specific aerial image. |
| Image resolution in Plan View |
Specify the default resolution at which to display aerial images in the Plan View. A lower resolution may provide faster performance, but image display quality will be affected. In the Referenced Image Properties pane, you can select to override this default setting for any specific aerial image. |
|
Sheet view |
|
| Display Type |
How the grid lines are displayed |
| Grid interval separation |
Fixed distance between displayed lines |
| Fixed grid line count |
Number of displayed lines along the shortest edge of the window. |
| Line color |
Choose the color to use for the grid lines |
| Line style |
Choose the line style used in the grid. |
| Annotation text |
Select whether the grid should have labels or not. |
| Scale bar |
Select the type of scale bar to display. |
|
Station Navigation |
|
| Station Interval |
The interval used to calculate regular stations along an alignment. |
|
Station/Offset View |
|
| Plot scale |
The factor used to convert between sheet units and ground units. Horizontal plotting scale for station/offset views |
| Vertical exaggeration |
The vertical exaggeration scale factor for station/offset views. |
|
Superelevation Diagram |
|
| Superelevation Diagram |
Select the plot scale to use to convert between sheet units and ground units, and the vertical exaggeration scale factor to apply to data displayed in the diagram. For more information, see Superelevation Diagram. |
| Grid Line Definition |
Specify how grid lines should display in a superelevation diagram. |
|
Tunnel Inspection View |
|
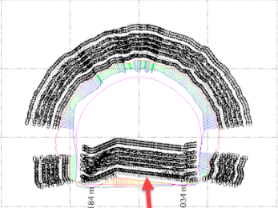
| Linear direction resolution |
Specify the resolution (mesh size) to apply parallel to the tunnel alignment in the Tunnel Inspection View. |
| Linear cross-section resolution |
Specify the resolution (mesh size) to apply perpendicular to the tunnel alignment in the Tunnel Inspection View. |
| Show two colors only Overbreak color Underbreak color |
Specify whether to display the Tunnel Inspection View using only two colors: one for overbreak and one for underbreak. If yes, select the color used for overbreak and underbreak mesh cells and delta lines. |
|
Plan View |
|
| Legend |
Select to show/hide a color/delta value legend in the Inspection Plan View. |
|
Tunnel View Grid for Plan View, Cross-Section View, and Delta View |
|
| Display type Grid interval separation Fixed grid line count |
Select how grid lines display in the graphic view. If Grid Interval is selected, specify the interval distance. If Fixed number of grid lines is selected, specify the number of grid lines to display along the shortest edge of the view. |
| Line color Line style |
Select the color and line style to use for grid lines in the graphic view. |
| Annotation text |
Select to show/hide grid line labels in the graphic view. |
| Scale bar |
Select to show/hide a scale bar in the graphic view. |
|
Cross-Section View |
|
| Vertical exaggeration |
Specify the ratio for vertical exaggeration in the Cross-Section View. See "Vertical exaggeration" in "Corridor Template View" above. |
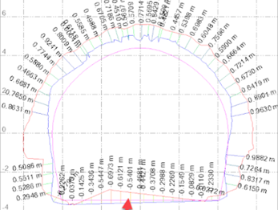
| Tunnel shape |
Select to show/hide the tunnel shape in the Cross-Section View. Note: If a design mesh is used in the comparison either as the base mesh or the comparison mesh, it's shape is considered to be the "tunnel shape". If a design mesh is not used in the comparison, the shape of the base mesh is considered to be the "tunnel shape". |
| Tunnel shape color |
Select the color for the tunnel shape in the Cross-Section View. |
| Base mesh color |
Select the color for the base in the Cross-Section View. |
| Delta labels |
Select whether to display delta value labels in the Cross-Section View, and the scale to apply to displayed labels. |
| Label interval |
Specify the distance interval at which labels are displayed in the Cross-Section View. This setting is useful when you want to maintain a high level of density in the Inspection Plan View while still being able to view readable labels in the Cross-Section View. Small distance interval:
Large distance interval:
|
| Comparison mesh color |
Select the color for the comparison mesh in the Cross-Section View. |
| Base mesh line weight |
Specify the weight to apply to the base mesh line in the Cross-Section View. |
| Comparison mesh line weight |
Specify the weight to apply to the comparison mesh line in the Cross-Section View. |
| Delta line weight |
Specify the weight to apply to the delta lines in the Cross-Section View. |
| Tunnel View Grid |
See "Tunnel View Grid for Plan View, Cross-Section View, and Delta View" above. |
|
Delta View |
|
| Vertical exaggeration |
Specify the ratio applied for vertical exaggeration in the Cross-Section View. See "Vertical exaggeration" in "Corridor Template View" above. |
| Base color |
Select the color for the line representing the base mesh in the Delta View. |
| Delta color |
Select the color for the line representing the delta of the comparison mesh compared to the base mesh in the Delta View. |
| Delta base line weight |
Specify the weight to apply to the base mesh line in the Delta View. |
| Delta line weight |
Specify the weight to apply to the comparison mesh delta line in the Delta View. |
| Tunnel View Grid |
See "Tunnel View Grid for Plan View, Cross-Section View, and Delta View" above. |
|
Tunnel Set Outs |
|
| Tunnel Set Outs |
Specify colors to apply to tunnel set outs. Note: Tunnel set outs are shown in the View Filter Manager, allowing you to toggle visibility for each of the five tunnel set out types (blast hole, horizontal, pipe, radial, and vertical) on and off in 3D, Plan, Station, and other views. |
|
Tunnel View |
|
| Vertical exaggeration |
Specify the ratio for vertical exaggeration for the geometry displayed in the graphic view. See "Vertical exaggeration" in "Corridor Template View" above. |
| Radius line Radius line color |
Select to show/hide in the graphic view the radius lines used to build the tunnel shape, and select the display color. |
| As-built tunnel mesh color |
Select the color for an as-built tunnel mesh in the graphic view. |
| As-built point As-built point color As-built point ID |
Select to show/hide in the graphic view tunnel as-built points, and select their display color and whether to show/hide their point IDs. |
| Convergence point Convergence point ID |
Select to show/hide in the graphic view tunnel convergence points, and select whether to show/hide their point IDs. |
| Maximum displacement arrow length on screen |
Specify the number of pixels to use for the arrow to display the largest displacement vector in the graphic view. |
|
Corridor Display Options |
|
| Node labels Node label format Node label rotation Elevation in node label |
If you choose to include a corridor template's cross-section in the view, select to show/hide any abbreviations in the Tunnel View that you added for template nodes using the Manage Template Node Names command. If Node labels is set to Show, select whether to display the full label or an abbreviation, whether to show displayed node labels vertically or rotated, and whether to show/hide node elevations in the labels. |
|
Convergence Point |
|
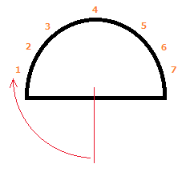
| Markers Colors |
Select the symbol and color to use in the graphic view for each convergence point marker. Each marker and color in each of the lists includes a number that corresponds with a convergence point located around the tunnel in the order shown here:
|
|
Grid Line Definition |
|
| Display type Grid interval separation Fixed grid line count |
Specify how grid lines display in the graphic view. If Grid Interval is selected, specify the interval distance. If Fixed number of grid lines is selected, specify the number of grid lines to display along the shortest edge of the view. |
| Line color Line style |
Specify the color and line style to use for grid lines in the graphic view. |
| Annotation text |
Select to show/hide grid line labels in the graphic view. |
| Scale bar |
Select to show/hide a scale bar in the graphic view. |
|
Vector Spreadsheet |
|
| Vector spreadsheet |
Specify whether to show or hide general vector information, statistics, observed data, antenna specifications, time, device orientation, and network adjustment variance group used in the Vector Spreadsheet. |