Vector Spreadsheet
The Vector Spreadsheet lists the vectors in the current project. The data can be sorted by clicking at the top of any column. The Plan View and the Properties pane reflect all changes made to data in the spreadsheet view. For details on columns in the vector spreadsheet, see View Settings.
To create a new vector spreadsheet:
- Select Vector Spreadsheet in Home > Data.
- Right-click a vector, and select New Vector Spreadsheet from the context menu.
To navigate the spreadsheet:
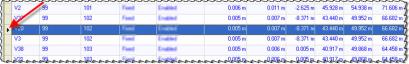
- To select a vector, click in the left column for that row.
To display vector details:
- Select the vector (click on the left edge of the row) and press or right-click and select Properties. The Properties pane displays.
Note: The Delta X, Y, and Z values in the Vector Spreadsheet and the Vector List report reflect the distance from survey marker to survey marker, so Vector Length shows the distance of the ground slope.
To sort entries:
- Click on a column heading. An up
 or down
  icon appears in the selected column heading, indicating the current sort order (ascending or descending).
To copy data:
- Select data, and copy and paste it to a text editor (such as Microsoft® Notepad) by using the context menu or by pressing to copy and to paste. You can select all data by pressing .
To manage column display:
- Select Project Settings in the Quick Access Toolbar. Then click View and Vector Spreadsheet. For each type of data, select to Show or Hide the column in the spreadsheet. To change the order of columns across the spreadsheet, click and drag the column heading to a new location.
