Superelevation Diagram
The superelevation diagram, which is displayed in its own view tab, shows how the roads cross slope changes through each station in an alignment. Text and lines can be added to the diagram. Add a frame around an area of interest, then create a dynaview using the frame, to display the frames contents in the plan view or a sheet view.
To view a superelevation diagram, right click the alignment and select superelevation diagram from the context menu.
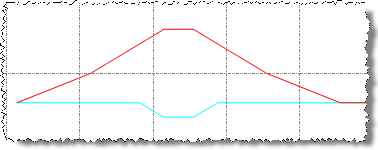
The diagram includes grid lines against which the superelevation profile is displayed. Vertical grid lines represent stations in the alignment. Horizontal grid lines represent degrees of slope. The two colored lines, which make up the superelevation profile, represent the inside and outside edges of the road.
The superelevation view is updated automatically as you make changes on the Superelevation tab.
If you have created a shareable slope table the shareable slope table profile will be displayed in the superelevation diagram. Select this profile to:
- edit the shareable slope table.
- edit the appearance of the shareable slope table profile.
- use the shareable slope table to define the slope in a template instruction.
See Create and Edit Shareable Slope Tables.
To configure the display of the superelevation template, use the Project Settings dialog.
To view and change Superelevation Diagram project settings:
- Select Project Settings in the Quick Access Toolbar.
- In the Project Settings dialog, select View > Superelevation Diagram in the navigation list.
- View and change the Plot scale and Vertical exaggeration settings as necessary.
- To view and change grid line properties, select View > Superelevation Diagram > Grid Line Definition in the navigation list.
- When you are done, click OK.
To add and modify text and line work in the superelevation diagram:
- To add text objects to the superelevation diagram, in the Create Text pane, click in the Text insertion point box, then click a text position in the superelevation diagram. See Create and Edit Text.
- The following line work can be added to the superelevation diagram:
- Linestrings/Polygons - Click in the Coordinate box, then click the location of the point in the superelevation diagram. See Create a Linestring.
- Polylines - Click in the Next Point box, then click the location of the point in the superelevation diagram. Create a Polyline.
- Rectangles - Click in the Corner one box, then click the location of the rectangle corner in the superelevation diagram. Repeat for corner two. See Create a Rectangle.
Note: Any closed line can be used as a frame for a dynaview. The dynaview can then be placed in a sheet view or plan view. See Create a Dynaview.
- To modify the text or line work, right click the object in the superelevation diagram, and select Properties from the context menu.
