Perform a Scan Inspection and Run a Scan Inspection Report
Use the Scan Inspection command to display positioning deviations between either of the following pairings:
- One or more 3D mesh or surface objects (including projected and corridor surface objects) and a single point cloud region
- Two point cloud regions
The command creates a differential color map ("heat map") that graphically displays the deviations between the selected objects in a variety of formats by applying keyed colors to the scan points. You can view the color map in graphic views, and you can run a Scan Inspection Report (described later in this topic) showing specified inspection points and their comparison deviation values and, optionally, the color map itself.
Notes:
- You can run a Scan Inspection Report for any 3D inspection saved in your project (not just a newly created inspection). See "Run a Scan Inspection Report" later in this project.
- You can import a scan inspection from Trimble Access.
Prerequisites:
- See the Subscription Plans page. For a license matrix by command, see the License page in the TBC Community. Also see View and manage licensed features.
To perform a scan inspection:
- Do the following as necessary.
- If they do not already exist, create the point cloud region to be compared in the inspection.
- If you are including a 3D mesh or surface object in the inspection, be sure that it is displayed in the project and its wireframe is hidden (Wireframe is set to No in the Properties pane).
Note: To ensure optimal inspection results, the imported point cloud must include projection orientation normals.
- Select Scan Inspection in Point Clouds > Measure to display the Scan Inspection command pane.
- In the Inspection name field on the Create tab, enter a name for the scan inspection that will display in the Project Explorer when you save the inspection in your project.
- Select the appropriate Inspection type.
- Scan to 3D object - Click in the 3D object selection field and then use the Project Explorer or 3D View to select one or more 3D mesh or surface objects you want to include in the inspection. Then, in the Reference point cloud region drop-down list, select the point cloud region to which you want to compare the selected 3D objects.
Optionally, if you are working with 3D mesh objects, you can click the Internal Select Mode icon located in the TBC Status Bar (or press Ctrl+F) to toggle on and off the "Internal Select" mode. This mode enables you to select just one or more faces of a mesh object you want to compare to the selected point cloud region, as opposed to all of the object's faces being selected when you select the object. This gives you more precise control over your inspection deliverables. Press the Ctrl key to make multiple face selections on one or more mesh objects.
- Scan to scan- Using the drop-down lists, select the Origin point cloud region and Reference point cloud region you want to compare.
- Scan to 3D object - Click in the 3D object selection field and then use the Project Explorer or 3D View to select one or more 3D mesh or surface objects you want to include in the inspection. Then, in the Reference point cloud region drop-down list, select the point cloud region to which you want to compare the selected 3D objects.
- In the Maximum distance field, enter a distance between the selected objects that, if exceeded will cause a scan point to be excluded from the comparison (considered an outlier).
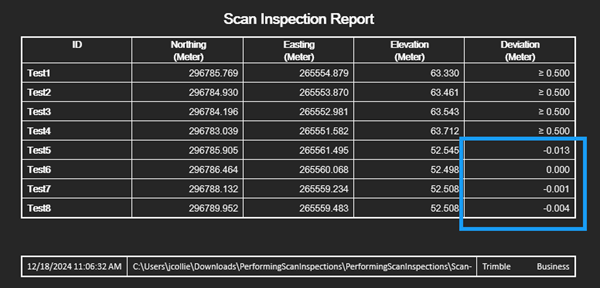
- A scan can sometimes indicate negative delta distances. This can happen if portions of scan 2 are on both sides of scan 1 (see the following image). Optionally, check the Use absolute distances (positive values only) check box to specify that all negative delta distances (that is, distances inside the 3D object or origin point cloud) be made positive.
The following image shows a scan with negative values.
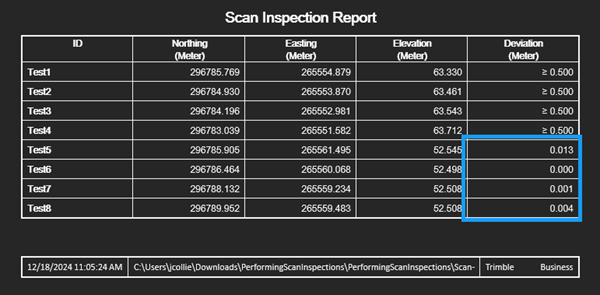
The following image shows a scan with the Use absolute distances (positive values only) checkbox checked.
- In the Color map drop-down list, select the color map you want to use to display the comparison data.
- When you are ready, click the Save Inspection button to save the scan inspection in your project.
Note the following:
- The new color map is displayed in the 3D View, and it is represented by a new Point Cloud Inspections child node in the Project Explorer.
- You can use the View Filter Manager to hide or show the Point Cloud Inspection color map in the 3D View. (The associated scan must also be displayed.)
- To view and hide the legend for the color map, right-click the new Point Cloud Inspections child node in the Project Explorer and select Toggle Legend.
- To view properties for a scan inspection, right-click it in the Project Explorer and select Properties. In the Properties pane, you can change the Maximum distance and/or toggle Absolute distances off and on.
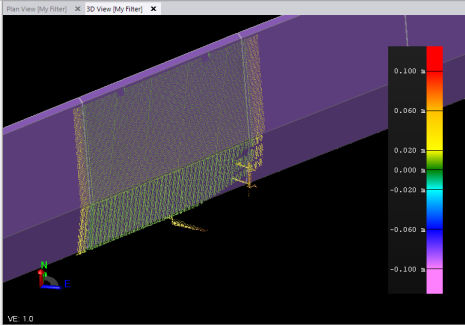
Following is an example of scan-to-scan color map. Note that the related scan and the color map (Point Cloud Inspection) must both be selected for display in the View Filter Manager for the map to display. In this example, all objects other than the color map and its related scan are hidden.
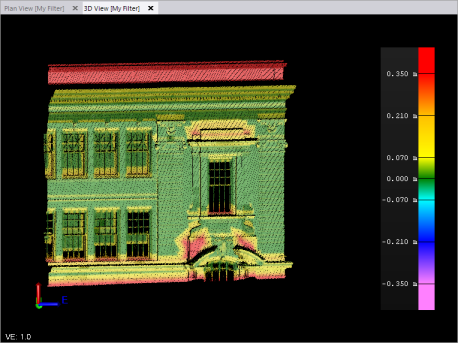
In this example of a scan-to-3D object color map, all objects other than the color map, its related scan, and the 3D object used in the comparison are hidden.
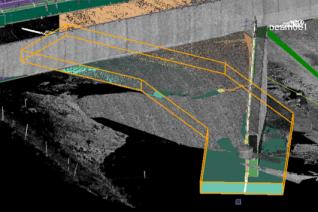
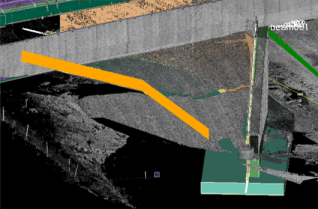
In the next two examples you can see where (1) an entire mesh has been selected and (2) where only two faces on the mesh have been selected using the Internal Select Mode.
You now have the option to run a Scan Inspection Report as described below.
To run the Scan Inspection Report:
You can run an MS Word-based 3D Inspection Report for any 3D inspection saved in your project.
- In the Scan Inspection command pane (select Scan Inspection in Point Clouds > Deliverables), click the Report tab.
- In the Inspection drop-down list, select the scan inspection for which you want to run a report.
Next, you will create one or more points at locations of interest on the color map where you want the deviation distance between the two objects to be included in the Scan Inspection Report.
You also have the option of selecting existing points in your project as described later in this procedure.
- Optionally, change the default Name prefix and Layer to be used for the new point(s) you will create.
- Optionally, use the View Filter Manager to hide some or all of the unrelated data displayed in the 3D View.
Make sure that at least the related scan and Point Cloud Inspection color map remain displayed.
- Click in the Coordinate field and then, in the 3D View, select a location on the color map for the new point.
Note the following when creating points:
- When you make a selection, the coordinate for the new point is displayed in the Coordinate field.
- Each new point is displayed in the 3D View as a green cross.
- Each new point is represented by a new point node in the Project Explorer.
- Each time you create a new point, the Number of points value displayed in the Inspection Points for Report group box is increased by 1.
- Select additional locations as necessary to create additional points to be included in the report.
Following is an example of a scan-to-scan inspection showing four new points "of interest" on the color map:
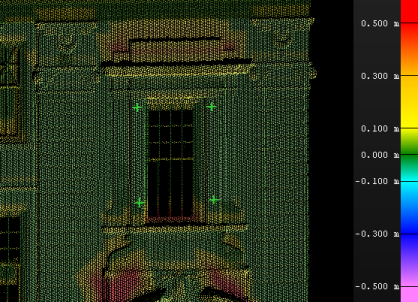
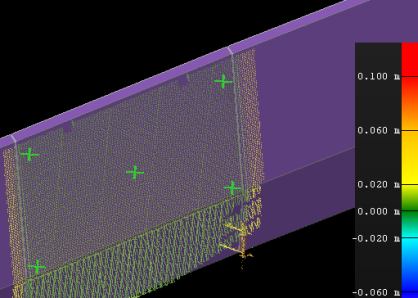
Here is an example of a scan-to-3D object inspection showing five new points "of interest":
- Optionally, to include any pre-existing points in the report:
- Click in the Inspection Points for Report selection field.
- In a graphic view or the Project Explorer, select the points you want to include.
A warning message displays if a selected point is too far from the inspection. The point will not be included in the report.
- Click the Add button.
The Number of points value increases accordingly.
- Optionally, check the Add view to report option check box to include an image of the color map in the report.
- Click the Generate Report button.
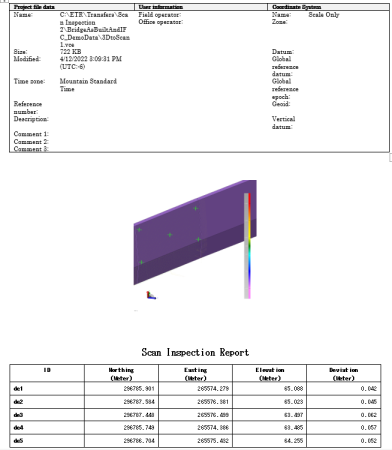
The new report opens in MS Word. In addition to project data, the report includes position and deviation values for each selected point displayed in a tabular format. If the Add view to report option was selected, the report also includes a screen-captured image of the color map.
Following is an example of a Scan Inspection Report: