Run a Mining Slope Conformance Report
The Mining Slope Conformance report includes slope cross-section details and a heat map based on an open pit mine surface model that visually indicates overall slope conformance compared to design parameters such as bench height, width, and face angle, and identifies potential areas of safety concern on the mining slope. This report can be customized as necessary to meet specific client needs using a Microsoft Word template (see Create and Edit Customized Report Templates).
Prerequisites:
- Your project must include an as-built surface with extracted breaklines indicating the location of vertical steps in the surface. You can extract breaklines from an appropriate point cloud (as described in Extract Breaklines from Open-Pit Mines) and create a surface from the breaklines (as described in Create a Surface) to use in this report.
- To ensure your project name displays in the footer of the report, select Project Settings in the Quick Access Toolbar. Then, select General Information and enter it in the Project Name field.
- See the Subscription Plans page. For a license matrix by command, see the License page in the TBC Community. Also see View and manage licensed features.
To run a Mining Slope Conformance Report:
- Select Mining Slope Conformance Report in Mines > Conformance to display the Mining Slope Conformance Report command pane.
- In the Report template drop-down list, select Mining Slope Conformance Report.
- In the As-built mine surface model drop-down lists, select the as-built surface containing breaklines to be used in the report.
- Complete the Cross-section Settings as follows:
- Boundary - In the Plan View, select an existing closed polyline, or create a new one, that acts as a boundary to encompass a single slope region of the mine for which you want to report. A slope region should be one slope set of crest and toes (up to one half of the mine, not the entire mine).
- Breaklines - In the Plan View, use Shift+click or Ctrl+click to select the breaklines you want to include in the report. Or, click the Options button for other selection options. The breaklines indicate the location of vertical steps in the mine's surface, such as bench edges. Only those segments of the breaklines included in the selected Boundary are used in the report.
Note that incorrect report values may result if there are irregularities in the expected normal bench/face layout.
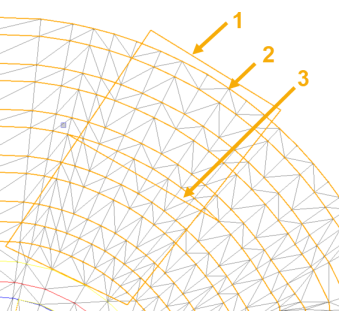
- Cross-section path - In the Plan View, select an existing polyline, or create a new one, that crosses the bordered area along which cross-sections will be generated perpendicular to it (up to the edge of the boundary). Typically, the line will run across the face of the slope as shown in the figure below. Be sure to extend the line beyond the Boundary line..
- Cross-section interval - Enter the distance between each cross-section border line to be drawn in the report.
The following image shows the selected Boundary (1), Breaklines (2), and Cross-section path (3) to be used for a report.
- In the Design Parameters list, enter the design measurements to which the actual measurements will be compared to determine areas that are in or out of the tolerances you specify in the next step.
- In the Output Settings list, enter the tolerances to be applied to determine if actual measurements are in or out of tolerance when compared to the Design Parameters. Optionally, select different tolerance colors to display.
- Enter the Number of bins in the histogram to specify how the histogram in the report is divided.
Each bin represents a bar in the histogram. You can edit this value to make the display of data distribution more course or more fine, depending on your needs.
- In the Image Scaling for Cross-section View group box, select how you want cross-sections to display in the report.
- Click the Apply button.
Processing progress is displayed in the TBC Status Bar.
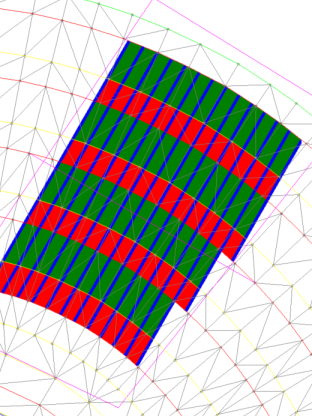
When processing is complete, the area segments included in the report are displayed as a georeferenced image in the Plan View, colored based on whether they are in (green) or out (red) of tolerance.
The Mining Slope Conformance Report opens in Microsoft Word.
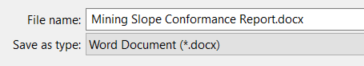
- To save the report document as a .docx file, in MS Word, click File > Save As and save the file to the appropriate location. Optionally, change the default file name.
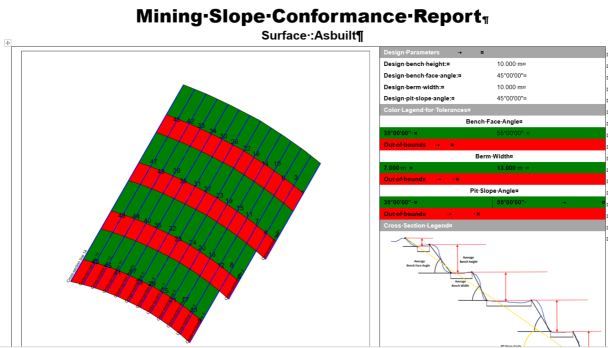
The first page of the Mining Slope Conformance Report includes the same image displayed on the Plan View showing color coded in-tolerance and out-of-tolerance area segments, but with cross-section lines and area segments labeled. It also includes the specified design parameters used for the report and the range of measurements consider "in-tolerance". A key is included to explain cross-sections displayed in the report.
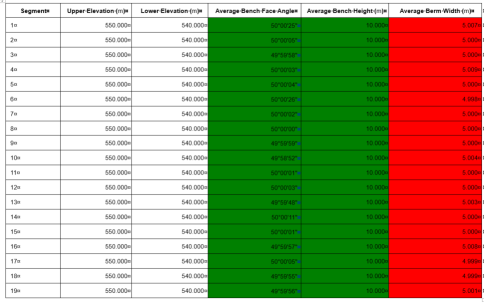
The second page of the report includes a table showing average measurements for each segment.
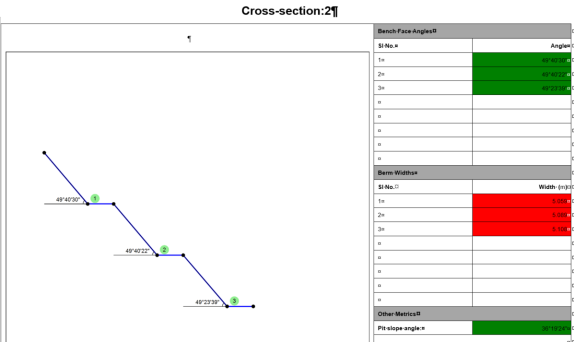
This is followed by a separate page for each cross-section in the report that includes a cross-section diagram and measurements.
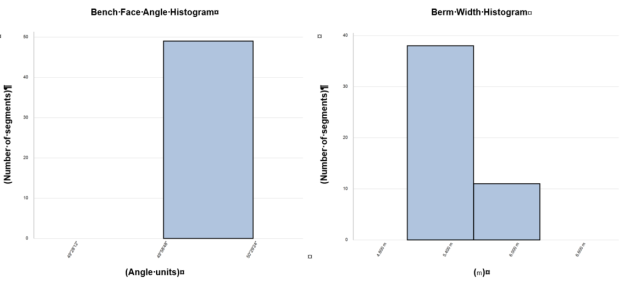
The report ends with histograms showing the distribution of segments within a range of bench face angles and berm widths.
Optionally, you can customize this report to meet specific client needs using a Microsoft Word template. See Create and Edit Customized Report Templates.
