Understanding Level Data
Level data acquired in the field and contained in a data file can be imported into Trimble Business Center and integrated, as necessary, with other data collected as part of a survey project (for example, GNSS or total station data). During and after the import, you can use the Level Editor to edit the level data to meet your specific needs.
You can import level data into TBC using any of the following methods:
- Use a predefined importer (for example, for Trimble DiNi or Spectra Geospatial Focus DL-15 level data).
- Create a custom importer matching your data file and use it to import the data.
- Manually key in the level data.
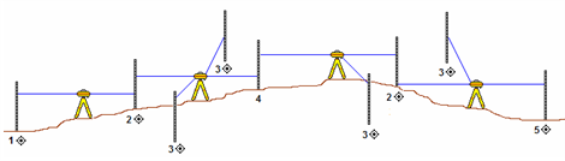
The following diagram shows four segments in a typical level run.
Key to diagram:
-
 identifies a control point (point of interest).
 - 1 identifies a benchmark control point.
- 2 identifies a control point used for a foresight for the preceding segment and a backsight for the following segment.
- 3 identifies a side shot (intermediate) control point.
- 4 identifies a turning point that is used as a foresight for the preceding segment and a backsight for the following segment.
- 5 identifies a control point that is used as a foresight for the preceding segment. This could also be a benchmark.
Level data is displayed in the following areas of the software:
- Project Explorer
Imported data is displayed in expandable nodes nested beneath the Import Files node. Point data is displayed in expandable nodes located beneath the Points node. You can expand and collapse nodes as necessary to view information. (See View Level Data in Project Explorer.)
- Properties pane
Click any node in the Project Explorer to display its properties in the Properties pane. You can edit certain properties in the pane.
- Level Editor dialog
When you import level data, the Level Editor dialog displays automatically, allowing you to review and edit the data before it is actually imported. To work with level data that has already been imported, right-click the level data file node in the Project Explorer pane and select Level Editor from the context menu to display the Level Editor dialog.
You can also use the Level Editor to manually enter level data in your project.
- Graphical and spreadsheet views
Points computed from level data are displayed in graphic (if they include x and y coordinates) and spreadsheet views.
