Time-Based View
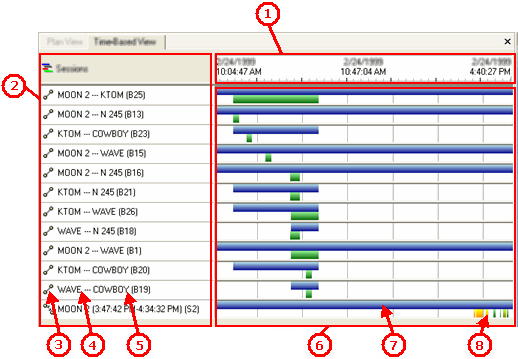
The Time-Based View displays your GNSS data in a chronological format that makes it easy to visualize how session and occupation times relate to each other, helping you check for valid sessions.

To access the command:
- Select Time-Based View in Survey > GNSS.
- Right-click Sessions (or a session) in the Project Explorer, and select New Time-Based View from the context menu.
- Right-click a baseline, and select New Time-Based View from the context menu.
For instructions on navigating the Time-Based View using menu commands, toolbar buttons, and your mouse, see 2D View Navigation.
|
Elements of the Time-Based View |
|
| 1 - Timeline |
Displays the span of one or more occupations in GPS time. The default view shows the time span for all project data, from the first occupation's start time to the end time of the last occupation. When you zoom to specific session data, the timeline changes to reflect the new time span. The current time format is displayed on the status bar. Click it to access GPS time settings in the Units section of the Project Settings dialog. |
| 2 - Sessions list |
Lists all of the sessions in chronological order, from the earliest to the latest session in the project. This list is similar to the session tree in the Project Explorer. Each session is defined by two concurrent or overlapping occupations. Note: Continuous files from CORS stations are often logged, and import, in one-hour increments. Once they have been imported, however, they are concatenated (joined sequentially) into the single observation they represent. |
| 3 - Session icon |
Indicates whether the session is a static or kinematic session
|
| 4 - Point ID of Upper Occupation |
Identifies the upper occupation in the session. In the example, it is the blue bar in the view. The same occupation can be represented in multiple sessions. |
| 5 - Point ID of Lower Occupation |
Identifies the lower occupation in the session. In the example, it is the green bars in the view. |
| 6 - Chronological view |
Plots each of the sessions, from start time to end time, in relation to the timeline. When you move the cursor in the chronological view, the timeline displays the exact time represented by the pointer's position. |
| 7 - Static occupation |
Each occupation is graphically represented from start time to end time, in relation to the timeline and its session. When you hover over an occupation in the chronological view, a tooltip displays the point ID and the duration of the occupation. Clicking an occupation highlights and adds a border to it in all sessions, enabling you to see the relationship between sessions. For static sessions, each bar represents a single occupation. |
| 8 - Kinematic session display |
The bar is broken to show stop-and-go occupations and/or continuous segments. |
|
Occupation colors |
|
| Blue |
Static occupation, generally at the base station |
| Green |
Static occupation, generally at the rover |
| Yellow |
Kinematic occupation - continuous segment |
| White |
Kinematic occupation - roving segment |