Run a Piling Quality Report
Use the Piling Quality Report command to see a summary and details on pairs of piles: the holes in a pile plan as compared to their corresponding as-built piles. Each as-built pile that is reported is qualified as passing, failing, or requiring action (based on the tolerances in Project Settings). The Piling Quality Report is generated as a Microsoft® Excel spreadsheet.
Note: If a pile plan contains piles with multiple piling method types, all columns will be generated but, some cells will show N/A where data is not applicable for a pile type. Values replaced by N/A will not cause a pile to be reported as failing.
Prerequisites:
- License; See the Subscription Plans page. For a license matrix by command, see the License page in the TBC Community. Also see View and manage licensed features.
- As-built piles that include quality comparisons with planned piles.
You can bring these piles into your project by importing piling results of as-built holes into a project that already includes a pile plan of the same name with related planned piles.
To access the command:
- Select Piling Quality Report.
To run a Piling Quality Report:
- Select a pile plan that has an associated plan with as-built pile data in the Pile plan list.
- If your piling project is based on a linear object/alignment (such as piling for a bridge), pick the centerline as a Reference baseline in the Plan View. This will generate an additional tab in the report called Baseline Quality Metrics. The values on this tab are written in station and offset format relative to the selected reference line.
- To limit the report to specific piles, check the Restrict to selected piles box, and select the piles or click Options for additional selection methods.
- To customize the quality tolerances, check the Override project settings box, and modify the 2D positional accuracy, 3D positional accuracy, and/or Inclination accuracy.
Note: The defaults for 2D and 3D positional accuracy, as well as inclination, are set in Project Settings > Computations > Piling.
- Click Apply if you want to run the report more than once, or click OK. The Drill Hole Quality Report opens in Excel.
To modify the report:
- Select
- Select Piling Quality Report in the Reports list.
- In the Settings group, specify report options.
- Click Apply and then click the Show Report icon on the pane's toolbar to run the report, or click OK to close the command.
|
Selected Report Components |
|
|
Summary tab |
|
Start and End |
This tab summarizes the information from the Quality metrics tab (see below). These denote the first and last times logged by the DPS machines for work on the selected pile plan. This is typically the start time of the first pile and the end time of the last pile. |
| Quantity |
This section lists the total number of piles that are evaluated in the report. Number of unplanned piles placed indicates as-built piles with no associated planned piles. These usually occur when one or more piles break during embedment or when they did not meet tolerances, so they were abandoned. When these unplanned piles are imported, they typically do not draw piles in graphic views because no pile types are identified; only a vector is drawn for each. Note: Failed piles that have been replaced in the field are retained in this report for the purpose of cost estimating; there is a cost associated with failed piles, and you may be able to charge out for them. |
| Number of Piles Failing |
This section indicates how many of the planned piles failed each criteria/tolerance. If a pile fails multiple criteria, it is still only counted once in the Total failing piles. |
| Count-Based Productivity |
This section simply scores productivity based on the number of as-built piles (planned piles placed) divided by their associated planned piles. |
| Length-Based Productivity |
This section scores productivity based on the Total embedded length of as-built piles divided by the expected embedment length (as set per pile type in the Manage Pile Types command) of all associated planned piles. |
| Penetration Rate-Based Productivity |
Average penetration rate indicates the average speed at which piles were embedded, as measured by dividing the total embedment length by the piling time. Estimated time to complete is calculated by dividing the Total embedment length by the Average penetration rate. |
|
Estimation Properties tab |
|
|
This tab helps you estimate costs and times for the piling job based on rates that you enter and calculations for completed work to date. Note: NA indicates that the as-built pile has no associated planned pile. |
|
| Total Cost and Time Estimates |
This section summarizes the times and costs for the entire pile plan, including completed work plus remaining work. |
| Pile Type |
This show the target embedment length for each pile (based on its type specified in the Manage Pile Types command). These values are used to calculate Costs and Estimates to the right. Note: As the yellow background indicates, you can copy historical embedded lengths from the Completed Work section under Intermediate Calculations to make the costs and estimates for remaining work more accurate. |
| Estimation Factors |
These are rates and costs that you supply and can edit to affect the Total Cost and Time Estimates. Any fields with a yellow background can be updated with historical values from the Completed Work section under Intermediate Calculations to make the costs and estimates more accurate. |
| Cost and Time Estimates |
These are computed and aggregated times and costs:
Note: Do not edit values in fields with gray or green backgrounds; editing them may corrupt the underlying formulas used to calculate the values shown. |
| Intermediate Calculations - Completed Work |
This section shows lengths, times, and costs for the planned work that has been completed, based on input rates (either estimated or historical). Historical/real rates from Completed work have a green background; these can be copied and entered in the Input rates section to improve time and cost estimations. Note: The Median and Average Embedded length for each pile should be close in value for you to have high confidence in an as-built pile. These as-built lengths include all spliced pieces and are measured to the cut-off elevation. |
| Intermediate Calculations - Remaining Work |
This section shows lengths, times, and costs for the planned work that has yet to be completed, based on input rates (either estimated or historical). |
|
Pile Types tab |
|
|
This tab simply lists properties for each type of pile represented in the plan. Values for these types were defined in the Manage Pile Types command before being added to the plan in the Create Pile command. |
|
|
Quality Metrics tab |
|
| Pile ID |
This tab tells you if the quality of each individual as-built pile is high enough to use or if it needs to be redone. These details are aggregated to appear on the Quality Summary tab. |
| Splices |
This lists the number of welds used for the pile; the number of pile sections that were spliced end-to-end in the field is one more than the number of splices. |
| Pile Type |
This lists the type of each individual pile in the report. NA indicates that the as-built pile has no associated planned pile. |
| Error Tolerances |
This section shows the tolerances defined for each pile (based on the defaults in Project Settings > Computations > Piling, which can be overridden in the Create Pile Plan command and/or the Piling Quality Report command. Note: Light red fields are associated with failing fields under Quality Tests. Planned/design values and tolerances are never red. |
| Quality Tests |
Each pile is tagged with a status for each quality criteria:
Note: A failure for 3D position may be caused by the top of pile location being saved prior to pile being cut off to the correct cutoff elevation. |
| Planned Pile As-Built Pile |
These sections list the top and bottom of the pile (start and end point coordinates), orientation, and inclination of the planned pile versus its associated as-built pile. Penetration rates are also shown for the as-built piles. |
| Delta Error Vector |
These sections list the 2D (planimetric) and 3D differences in length and direction between the top and bottom coordinates, orientation, and inclination of each planned pile versus its associated as-built pile. Note: The 2D length is measured in the horizontal plane of the planned cutoff location versus the as-built cutoff location. |
| As-Drilled Hole |
For Continuous Flight Auger (CFA) piles, this section lists the start and end point of the drilled CFA pile, orientation and inclination of the hole, the start and end time of drilling and penetration rates. |
| Total Duration |
The total time between the start of drilling a CFA drill hole and the end of piling. |
| Notes |
Notes entered by machine operators in the field. |
|
Baseline Quality Metrics tab |
|
|
|
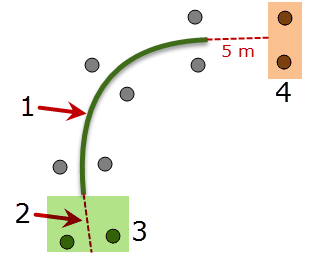
This tab is only generated if you picked a Reference baseline in the Piling Quality Report command (step 2 above). Values on the tab are written in station and offset format relative to the selected reference line. Note: When you select a reference baseline (1):
Note: If the computed station for a pile falls beyond the extents of the reference baseline, its values are reported as asterisks (*), denoting that they are invalid. |