Manage Grid Styles
Use the Grid Style Manager command to create and edit a variety of grid styles to use on dynaviews placed in sheet views. Using grid styles, you can control how gridlines, labels, ticks, and station equations appear on sheets built and plotted from a variety of sheet sets based on plan views, corridor cross-sections, alignment profiles, and mass haul diagrams.
Note: Grid axes mean different things for different types of data. For example:
For plan view data, X and Y = easting and northing
For profile view data, X and Y = station and elevation
For cross-section data, X and Y = offset and elevation
For mass haul data, X and Y = station and volume
Grid styles include settings for:
- Layer, type, color, line style, line weight, and dash length for major and minor gridlines and station equations
- Layers, colors, text styles, offsets, color, text alignments, back station template, and ahead station template for text labels and station equations
- Layers, colors, styles, lengths, and weights for major and minor tick marks
Prerequisites:
- Licensed module; See the Subscription Plans page. For a license matrix by command, see the License page in the TBC Community. Also see View and manage licensed features.
To access the command:
- Select Grid Style Manager in Drafting > Dynaviews.
To create a new grid style:
- Click New.
- In the Name box, enter a descriptive name for the grid style so you can easily identify your styles when you want to reuse them.
- Choose to either define the grid spacing in Model space or Paper space units.
- In the Minor interval box, specify the space between parallel grid lines that run perpendicular to the X axis (vertical lines).
- In the Major interval box, set how often to draw a (usually thicker) line between the minor interval lines. The minor and major intervals for the Y axis will match those set for the X axis.
- In the Grid Styles list (left pane), click + next to the name of your grid style to expand the tree of settings.
- Click Grid, and specify the grid's line type, dash length, layer, color, line style, and line weight. Check/uncheck the Draw box to show/hide the grid.
- If you have a corridor with one or more station equations, expand the Grid group, and click Station Equation to specify the grid's line type, dash length, layer, color, line style, and line weight. Check/uncheck the Draw box to show/hide the equation lines.
- If you have a corridor with one or more station equations, expand the Grid group, and click Station Equation to specify the grid's line type, dash length, layer, color, line style, and line weight. Check/uncheck the Draw box to show/hide the equation lines.
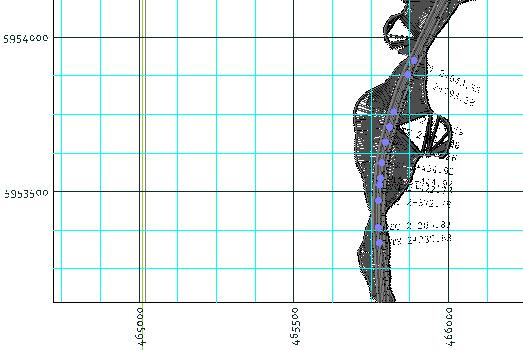
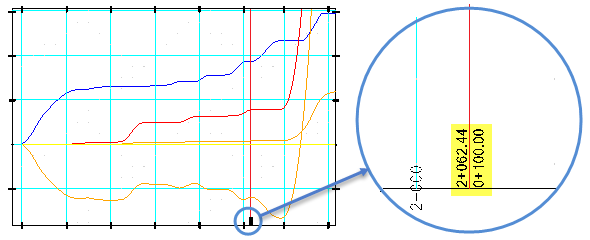
Figure: Station equation in a Mass Haul Diagram shown on a grid style in a sheet view
- Click Labels in the Grid Styles list, and specify the labels' template, text style, offset, layer, and color. If desired, check the Align to sheet box to align the labels to the orientation of the sheet, rather than horizontal and vertical. Check/uncheck the Draw box to show/hide the labels.
Note: In the Template boxes, {N} and {E} will label grid lines for Plan View data with northing and easting values, respectively. Data for other types of views (profile, cross-section, mass haul, etc.) should use the more generic {X} and {Y} in the Template boxes.
Tip: For Label Offset, if the label unexpectedly switches to top justification, add a slight offset to fix it/return it to bottom justification.
- If you have a corridor with one or more station equations, expand the Labels group, and click Station Equation to specify the back station template, ahead station template, text style, offset, layer, color. Check the Align to sheet box to align the station equation labels to the orientation of the sheet, rather than horizontal and vertical. Check/uncheck the Draw box to show/hide the equation labels.
Note: Station equation labels that overlap a grid label will hide the conflicting grid label.
Note: Station equation precision is determined by the value set in Project Settings > Units > Station.
- Click Ticks in the Grid Styles list, and specify the ticks' length, layer, color, line style, and line weight. Check/uncheck the Draw box to show/hide the grid.
- Click Close.
- To apply a grid style to a dynaview, select the dynaview, press [F11] and change the Grid style property.
For more information, see Create a Dynaview.
To edit and update a grid style used in a Sheet View:
- Reopen the Grid Style Manager, modify the grid style's properties, and click Close.
- In the Sheet View that uses the grid style, click Refresh All to apply the changes.
Dependencies:
- When you change a grid style, any grids that use that style (such as in a dynaview boundary collection) are updated in response.
