Create Line Label Tables
Create and display in the Plan View and Sheet View a table from selected line segments (linestring and polyline segments, rectangle and polygon segments, and arcs and circles) that automatically enumerates their attributes (for example, length, azimuth or bearing, and slope) based on the selected label table style.
Note: To ensure that the size of dimensions or labels is correct when viewed in the Plan View, verify that the plot scale for the project is set correctly in Project Settings > View > Plan View. The plot scale is the factor used to convert from ground units to sheet units (ground units / plot scale = sheet units). For example, if the default plot scale of 600 is used, an object with a length of 600 m in the Plan View will plot with a length of 1 m on paper. In survey feet, the default plot scale of 50 will plot as 1 foot on paper.
Prerequisites:
- Licensed module. See the Subscription Plans page. For a license matrix by command, see the License page in the TBC Community. Also see View and manage licensed features.
- label table style
To create a line label table:
- Select Create Line Label Table in Drafting > Tables to display the Create Line Label Table command pane.
- In the Title field, enter a title for the new label table.
The title will be displayed at the top of the table.
- Optionally, select a different Layer on which to display the new label table.
- In the Style drop-down list, select the style you want to apply to the new label table, or select <<New Style>> to create a new style using the Label Table Style Manager.
Note: The style you select may be designed to be used only with straight segments or curved segments.
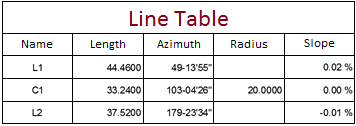
The label table style you select specifies the type of information to be displayed in each column in the table (for example, the length, azimuth or bearing, and slope of a straight line segment), the display of text in the table (including the use of unit suffices, formatting of angles and precision, and text justification,) and the appearance of the table itself (including text styles and table borders).
- Click in the Location field and then click in the Plan View where you want the upper left corner of the new label table to be located (or enter a coordinate).
The label table displays in the Plan View. It includes the table title you specified and the column headings and borders specified by the selected label table style. In addition, the Edit Label Table pane displays.
- Optionally, select the Exclude segment with length more than check box in the Edit Label Table pane and enter a length value for segments you want to exclude from the label table.
- Do either of the following to select the line segments you want to include in the label table:
- If you want to individually select each line segment to add as a row to the label table, click in the Select segment field and select each segment in the Plan View. The label table displays in the Plan View and is updated as you make each selection.
- If you want to select multiple line segments to add to the label table at one time, click in the Multi-select lines field and select the line segments in the Plan View (use Ctrl + click or draw a selection box to make your selection). If necessary, click the Option button for additional selection options. Then click the Add button. The label table displays in the Plan View and includes a row for each selected segment. Repeat to add additional line segments to the table.
Note: You can create a line label that specifies to include multiple segments in a label table. See Create Line Labels for instructions.
Each row in the label table includes a table tag label (name) that also displays on the associated line segment in the Plan View. At a minimum, the table tag label must include a sequential reference number. In addition, it might include a code representing the segment type (for example, "L" for a straight line segment or "C" for curved line segment). You can edit the format for the table tag label, as described in the following step.
Note: If a selected line segment already includes a label, it is replaced by the table tag label, which is added to the line label style as a new label type. (See Create and Edit Label Styles for more information about label styles.)
- To edit the table tag labels used with the label table, click the Table Tag expand arrow button and do any of the following as necessary:
- In the Table tag label style drop-down list, select the appropriate label style. Or, select <<New>> to create a new label style.
The label style you select determines the look of the table tag label.
- In the Line setting fields, edit the table tag label format (for example, enter "L#" for a straight line segment followed by a sequential reference number) and the starting reference number.
- In the Curve setting fields, edit the table tag label format (for example, "C#" for a curved line segment followed by a sequential reference number) and the starting reference number.
Your changes are displayed in the new label table in the Plan View.
The table tag label is added to the selected line label style as a new label type, allowing you to reselect when creating a new label table. (See Create and Edit Label Styles for more information.)
- In the Table tag label style drop-down list, select the appropriate label style. Or, select <<New>> to create a new label style.
Note the following when working with label tables:
- Each row in the table is updated automatically when any of the displayed attributes for the associated object changes (for example, a object is moved). If an object is deleted, the associated row is removed from the label table.
- The Explode command will break a label table into lines and text.
- When exporting project data to a DXF or DWG file, label tables are converted into CAD block objects, resulting in the loss of the association between tables and target objects.
- When importing label tables from DXF or DWG files, the tables are converted into CAD block objects, resulting in the loss of the association between tables and target objects.
